Track Every Dividend Payment Automatically
See your passive income broken down by month and by ticker. Interactive charts show trends over time, and your full payment history is searchable by symbol.
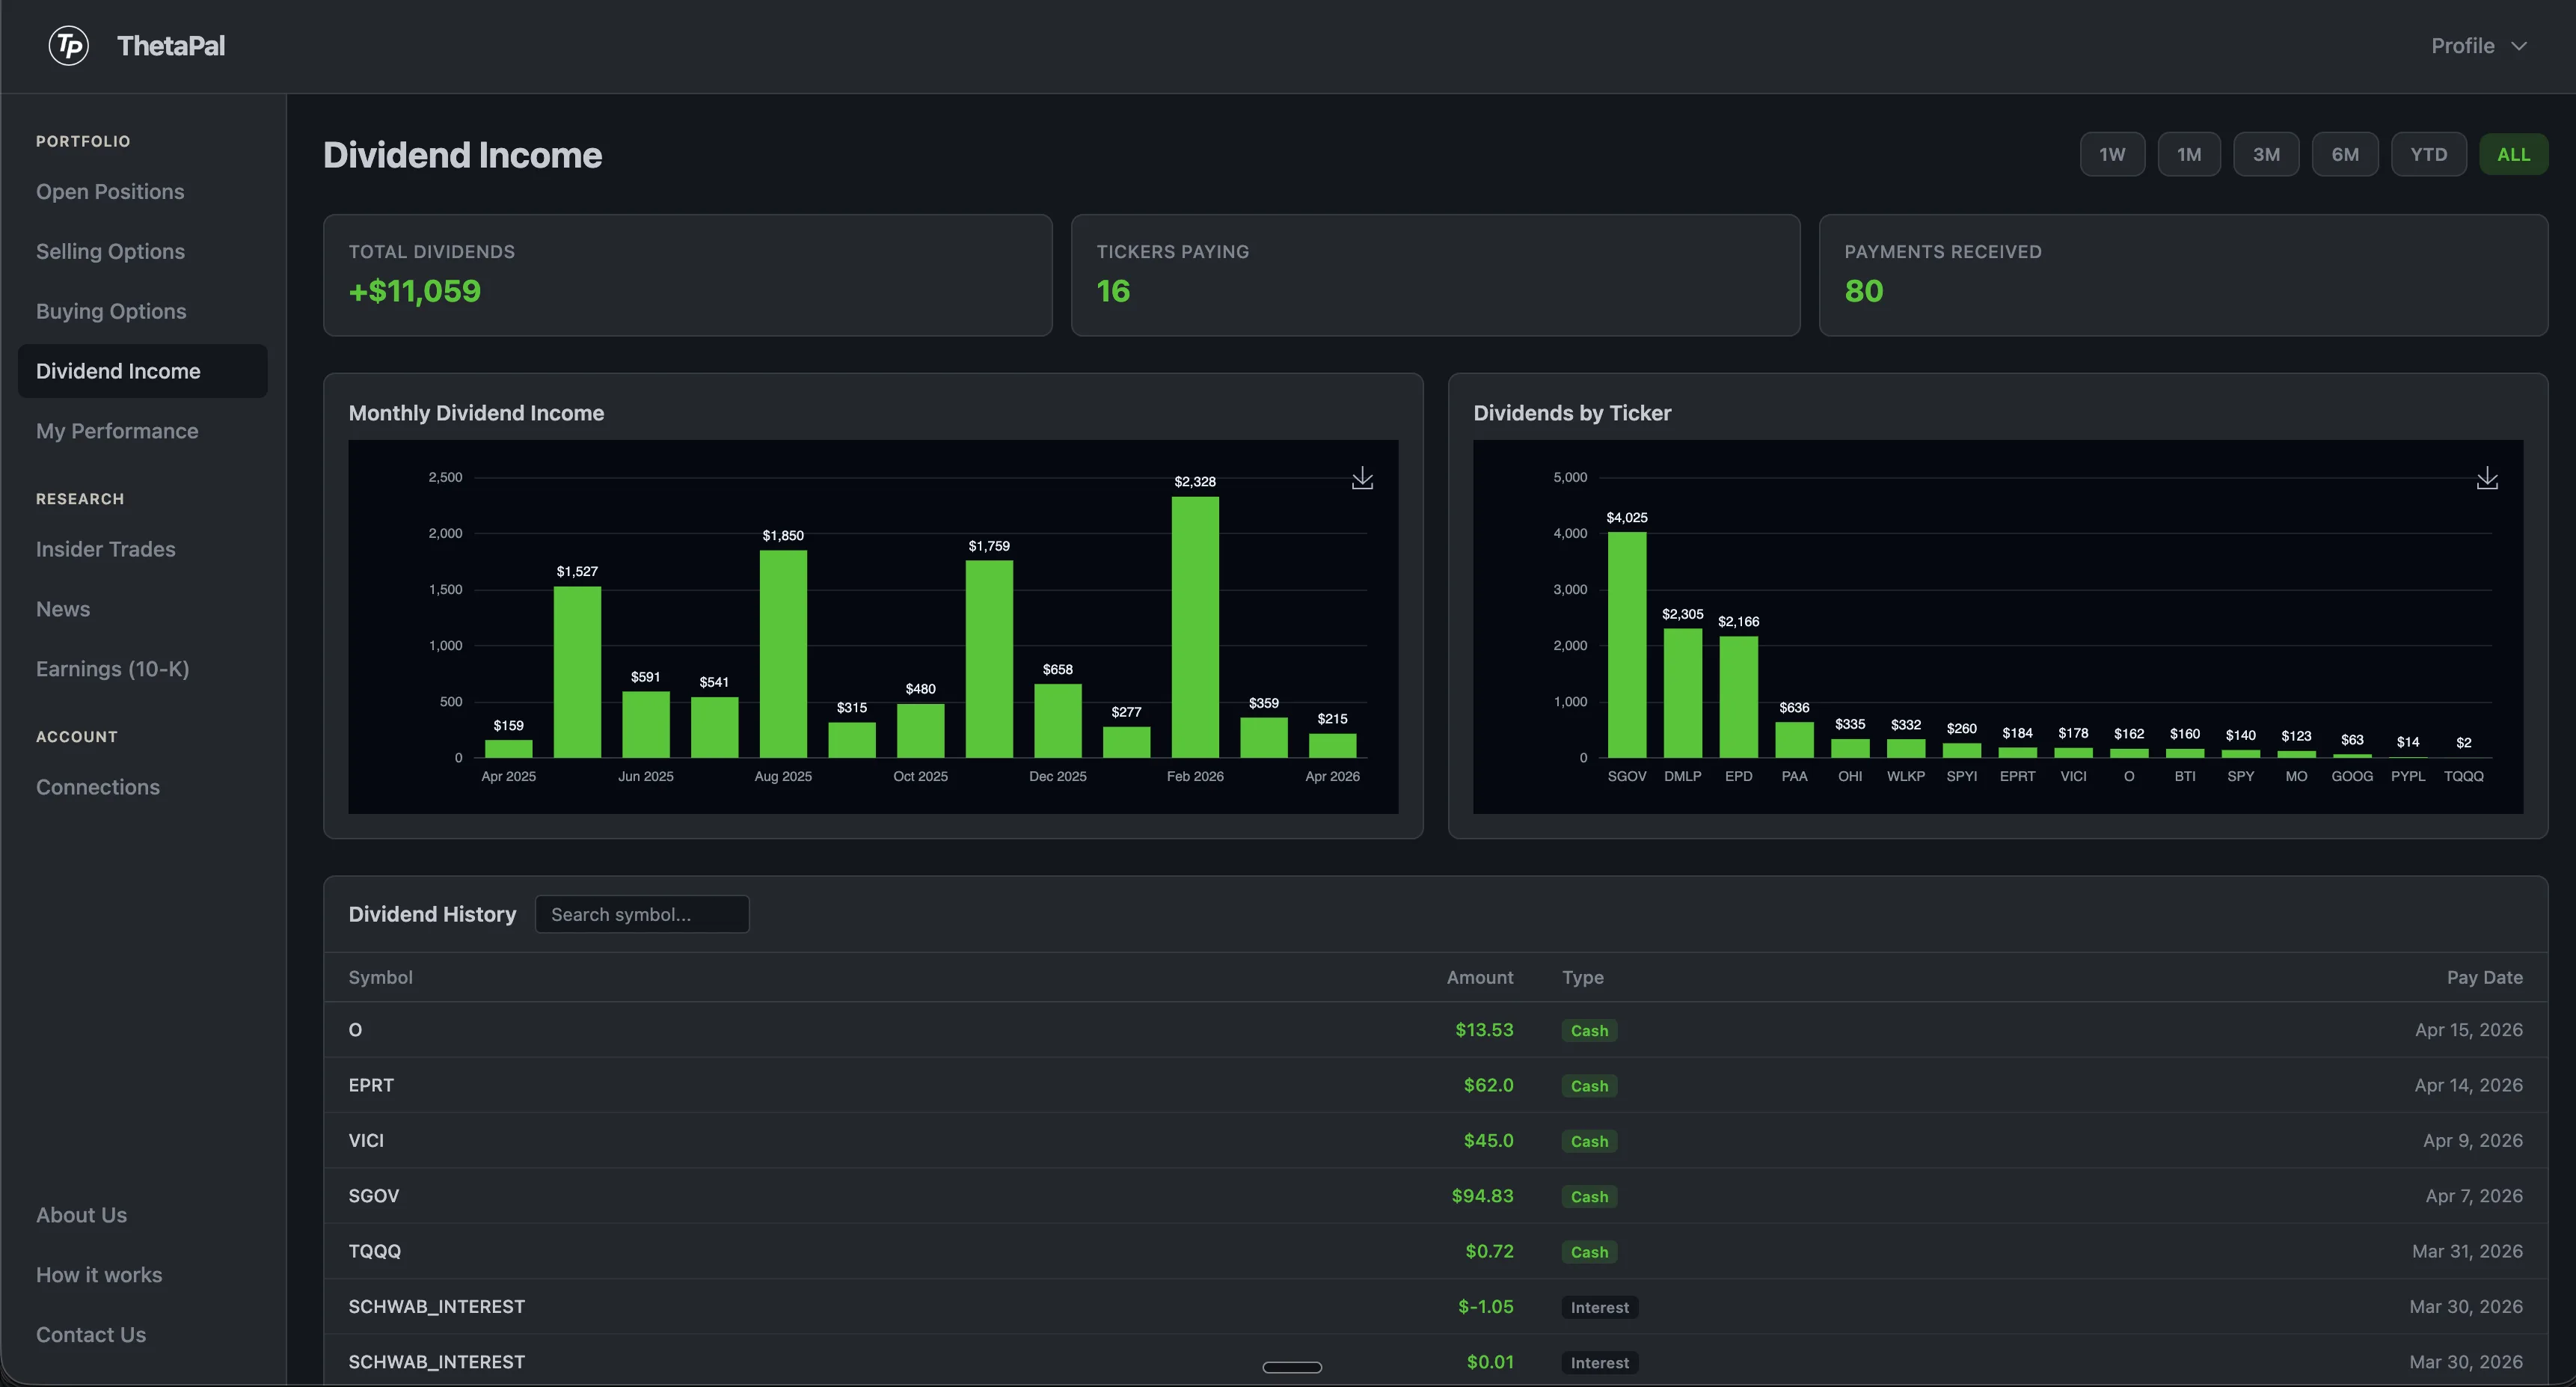
Your dividend income, visualized
ThetaPal automatically pulls dividend payments from your brokerage and breaks them down by month and by ticker. See which stocks are paying you the most and how your passive income trends over time.
The full dividend history table lets you search by symbol and see every payment date, amount, and type. Click any chart to expand it for a closer look.
Dividend tracking, simplified
No spreadsheets, no manual entry. Your brokerage data flows directly into clear, interactive charts.
Monthly Breakdown
See your dividend income charted month by month. Spot seasonal patterns and watch your passive income grow over time.
Per-Ticker Analysis
Know exactly which stocks are paying you the most. Compare dividend income across all your holdings at a glance.
Automatic Sync
Dividends are pulled directly from your brokerage. No manual entry — every payment is recorded automatically with date, amount, and ticker.
How it works
Connect
Link your brokerage through SnapTrade. Dividend history syncs automatically from your account activity.
Visualize
See monthly and per-ticker charts. Click any chart to expand it and explore the details.
Track
Search your full payment history by symbol. See every payment date, amount, and type in one table.
Frequently Asked Questions
How are dividends tracked?
ThetaPal automatically pulls dividend payments from your connected brokerage account. Every payment is recorded with the date, amount, ticker, and type. No manual entry required — your entire dividend history is synced automatically.
Which brokerages sync dividends?
Any brokerage connected through SnapTrade will sync dividend data. This includes Schwab, Fidelity, Robinhood, E-Trade, Vanguard, and 10+ more.
Can I see dividend history by month?
Yes. ThetaPal provides both monthly and per-ticker breakdowns of your dividend income. Interactive charts show your income trends over time, and you can click any chart to expand it for a closer look.
Is dividend reinvestment (DRIP) tracked?
ThetaPal tracks dividend payments as they appear in your brokerage activity. If your brokerage records DRIP transactions, they will be reflected in your dividend history alongside regular cash dividends.