Your Entire Portfolio at a Glance
See every position split into Wheel Tickers and Equity Holdings. Realized P&L, unrealized gains, dividend income, current price, and adjusted cost basis: everything you need without clicking into individual positions.
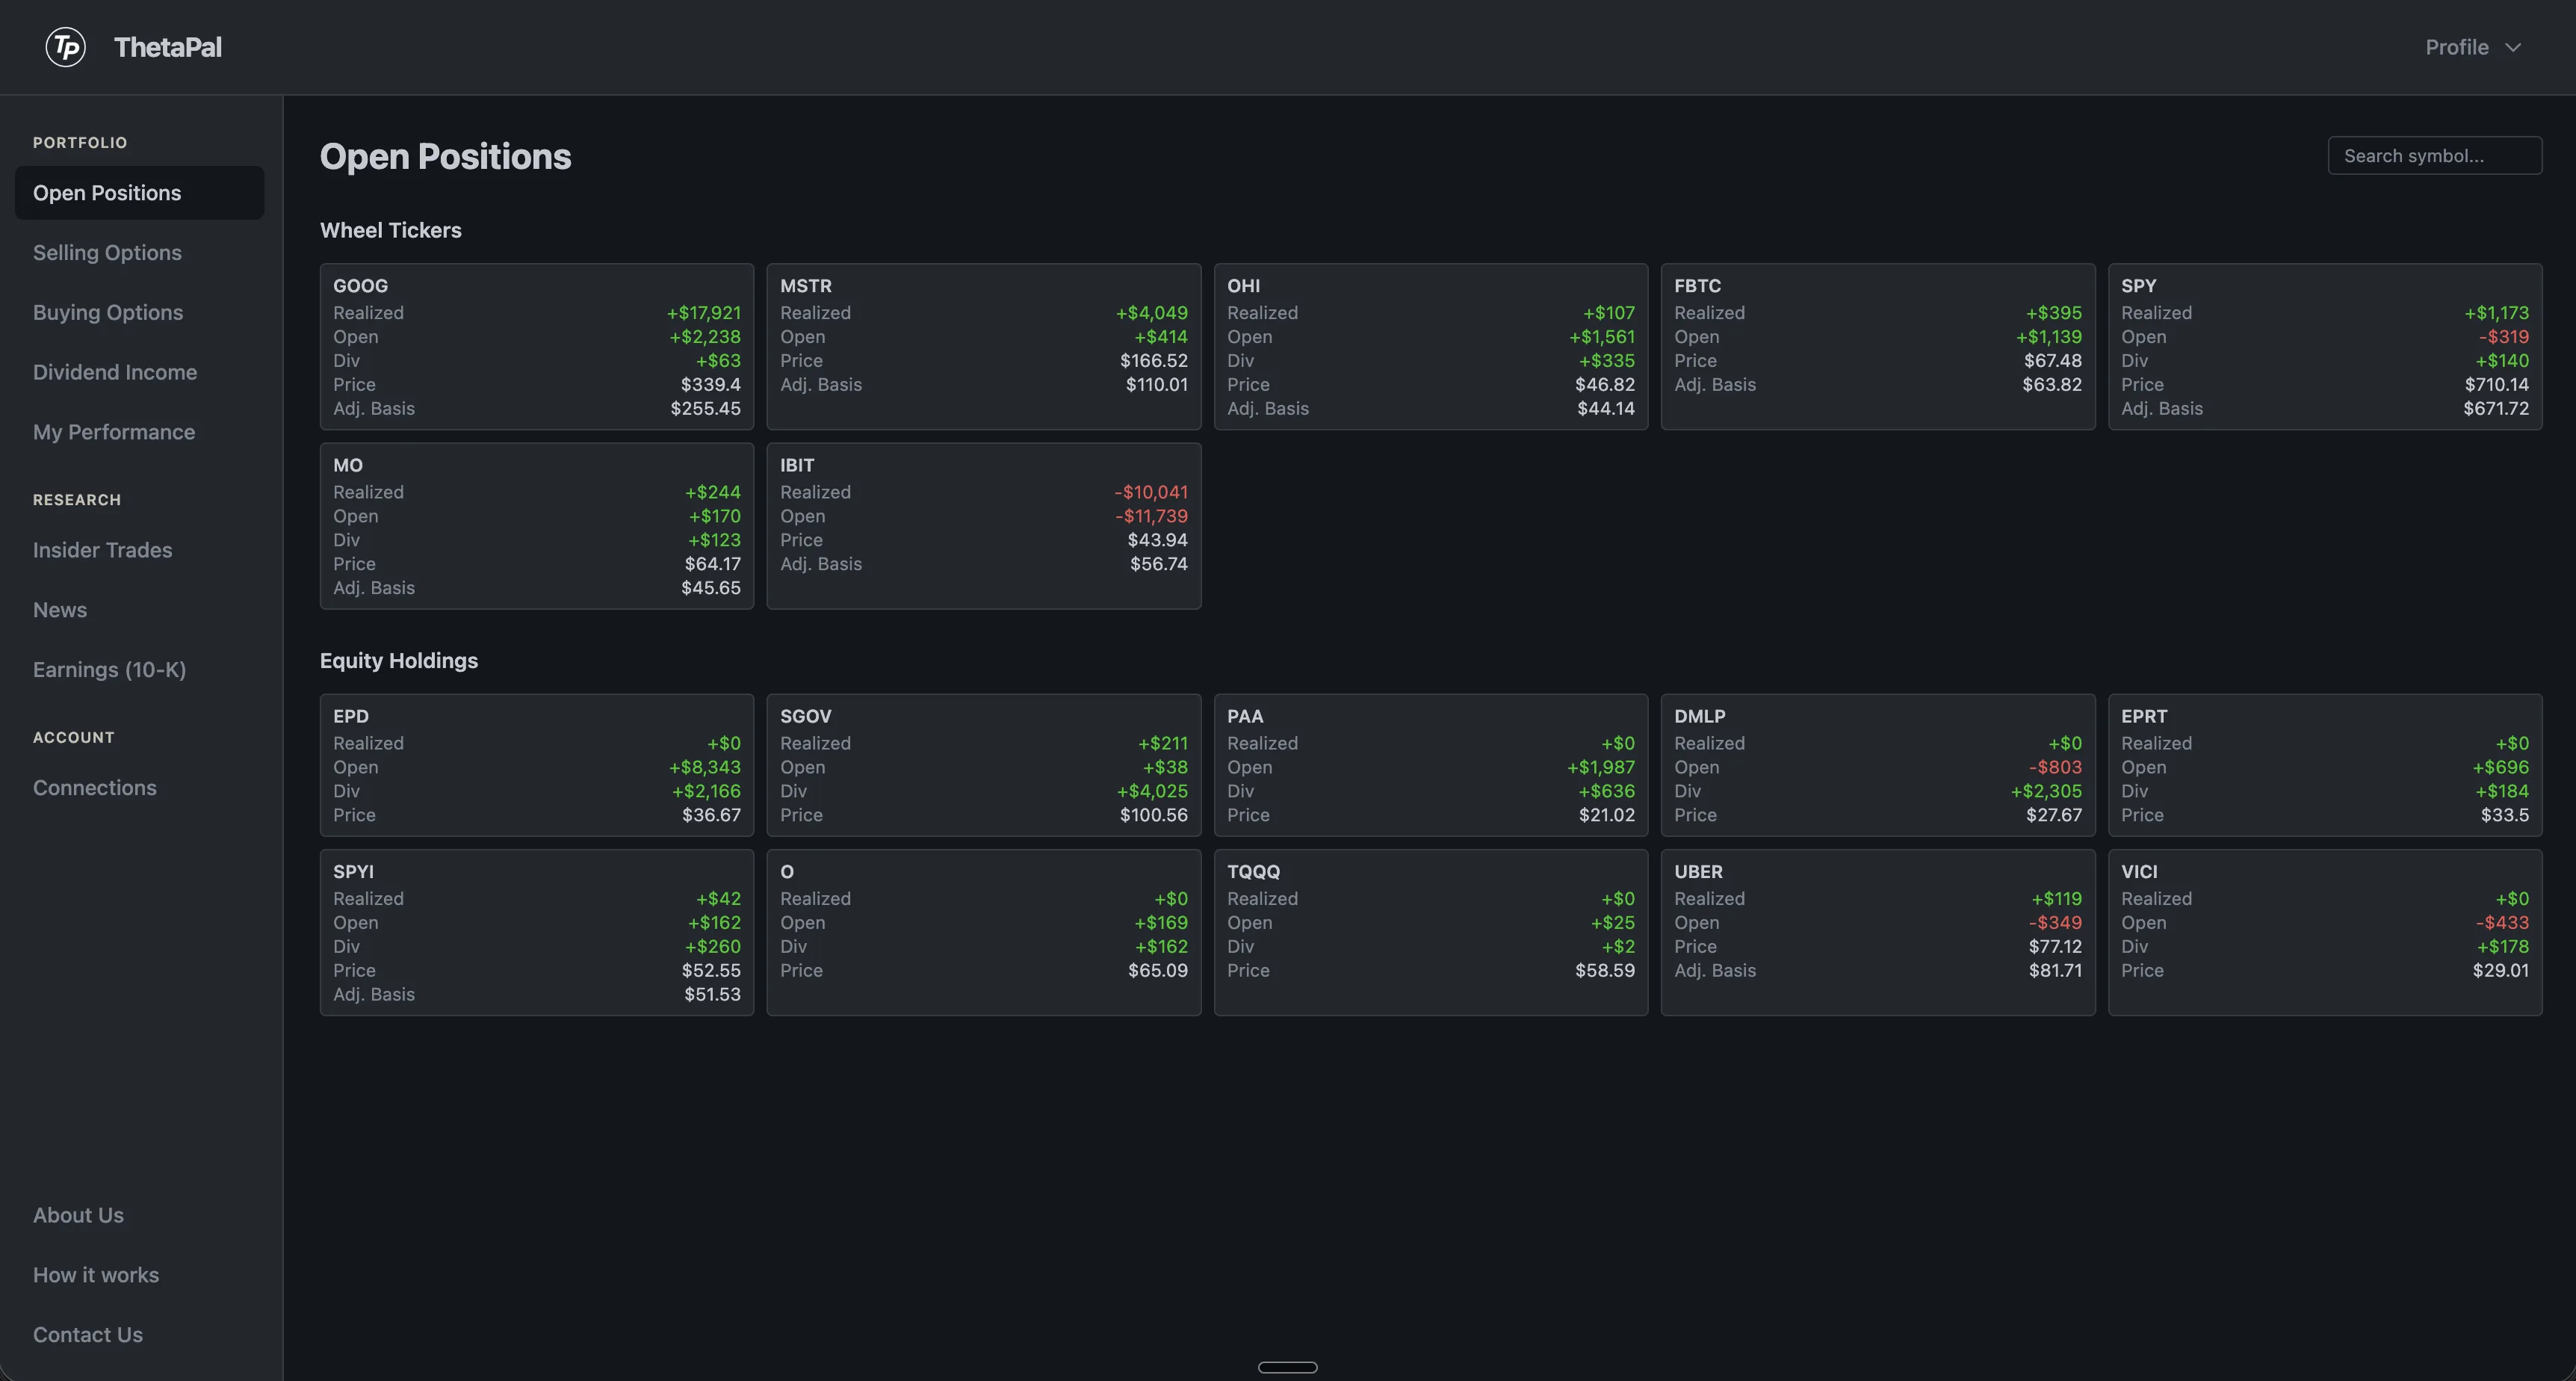
Two views, one dashboard
The Open Positions page splits your holdings into two clear sections. Wheel Tickers shows every stock where you're actively running the wheel strategy with options. Equity Holdings shows your buy-and-hold positions.
Each tile shows realized P&L, unrealized gains, dividend income, current price, and adjusted cost basis — everything you need to evaluate a position without clicking into it.
Every metric you need, per position
No more switching between tabs. All your key portfolio data in one organized view.
Wheel Tickers
See every stock where you're running the wheel. P&L, premiums collected, dividend income, and current option positions — all on one tile.
Equity Holdings
Buy-and-hold positions with current market value, unrealized gains, and cost basis. Simple, clean, and always up to date.
Adjusted Cost Basis
Your true entry price factoring in purchase price, option premiums collected, and dividends received. Know your real breakeven.
How it works
Connect
Link your brokerage. Positions, trade history, and dividends sync automatically.
Organize
ThetaPal splits your portfolio into wheel tickers and equity holdings. Each gets its own section with relevant metrics.
Evaluate
See P&L, cost basis, and market data per position. Click any tile to dive deeper into analysis and trade recommendations.
Frequently Asked Questions
What is the wheel tickers view?
The Wheel Tickers section shows every stock where you are actively running the wheel strategy with options. Each tile displays the underlying stock, your current option position, realized and unrealized P&L, dividend income earned, and your adjusted cost basis.
How is cost basis calculated?
ThetaPal calculates your adjusted cost basis by factoring in your purchase price, option premiums collected, and dividends received. This gives you a true picture of your effective entry price for each position.
Does it show unrealized gains?
Yes. Each position tile shows both realized P&L (from closed trades and premiums collected) and unrealized gains based on the current market price versus your cost basis.
How often do positions sync?
Positions sync automatically from your brokerage through SnapTrade. Stock quotes and option chains update every 15 minutes during market hours.
Want step-by-step instructions? Read our guide: How to track your options portfolio.