Measure Your Options Trading Performance
Total P&L, win rate, net premium collected, dividend income, monthly cash flow: everything you need to evaluate your strategy, filterable by any time range.
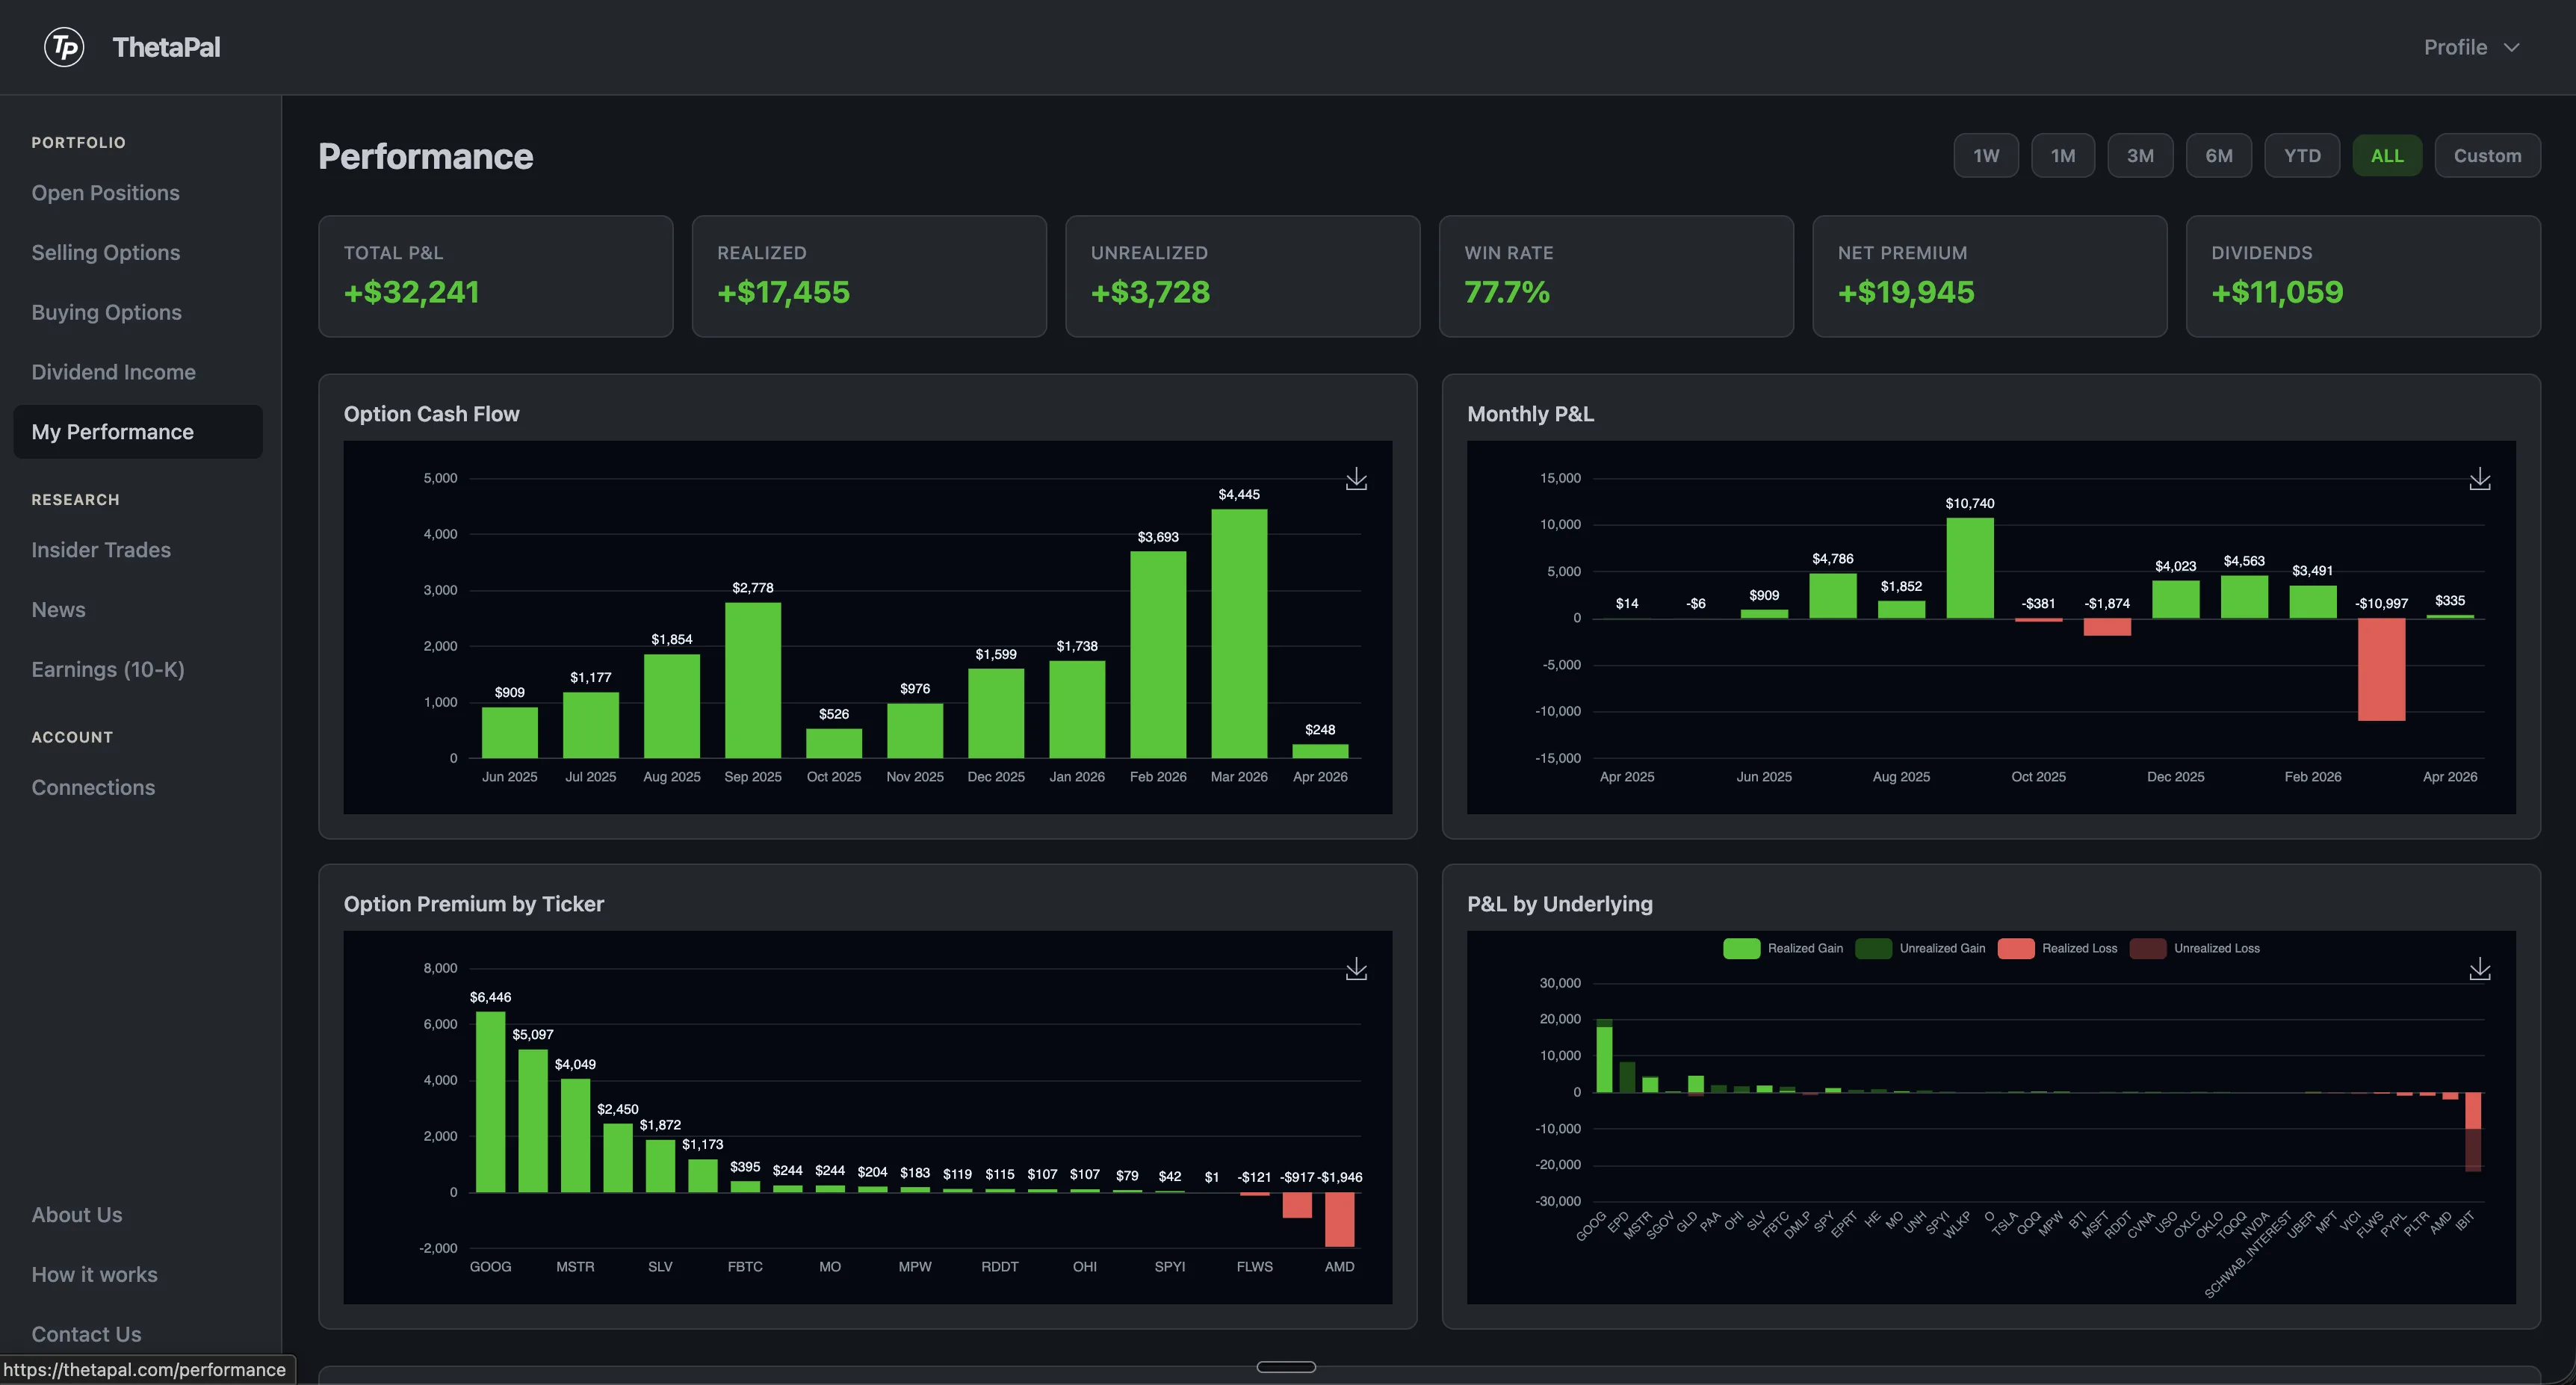
Your trading scorecard, in real time
Everything you need to measure how your portfolio is doing, filterable by any time range. KPI cards show your key metrics at a glance, and interactive charts let you dive into the details.
- •Total P&L, realized gains, and unrealized positions
- •Win rate across all closed trades
- •Net option premium collected
- •Dividend income earned
- •Monthly cash flow and P&L charts
- •Premium breakdown by ticker
Analytics that drive decisions
Know what's working, what's not, and where to focus your capital.
Win Rate & P&L
See your win rate across all closed trades, total realized P&L, and unrealized gains. The numbers that tell you if your strategy is working.
Monthly Cash Flow
Interactive charts show your monthly P&L and cash flow trends. Click any chart to expand it full-screen for a closer look.
Premium by Ticker
See which underlyings generate the most option premium. Identify your best performers and allocate capital accordingly.
How it works
Connect
Link your brokerage. Trade history and position data sync automatically to power your analytics.
Analyze
ThetaPal crunches your trade data into KPIs, charts, and per-ticker breakdowns. Filter by any time range.
Optimize
Identify your most profitable tickers and strategies. Double down on what works, adjust what doesn't.
Frequently Asked Questions
How is win rate calculated?
Win rate is calculated as the percentage of closed option trades that were profitable. A trade counts as a win if the total premium collected exceeds any losses from assignment or buyback.
What time ranges can I filter?
You can filter all performance metrics by any time range — week, month, quarter, year, or a custom date range. This lets you compare different periods of your trading history.
Does it track premium collected?
Yes. ThetaPal tracks total net option premium collected across all your trades, broken down by ticker so you can see which underlyings generate the most income.
Can I see per-ticker breakdown?
Absolutely. The dashboard shows premium breakdown by ticker, realized vs unrealized P&L by underlying, and each position's contribution to your overall returns.