
See the whole surface. Trade with clarity.
A delta-based heat map that puts every strike and expiration in front of you, color-coded by risk. Spot the best premium in seconds, not minutes.
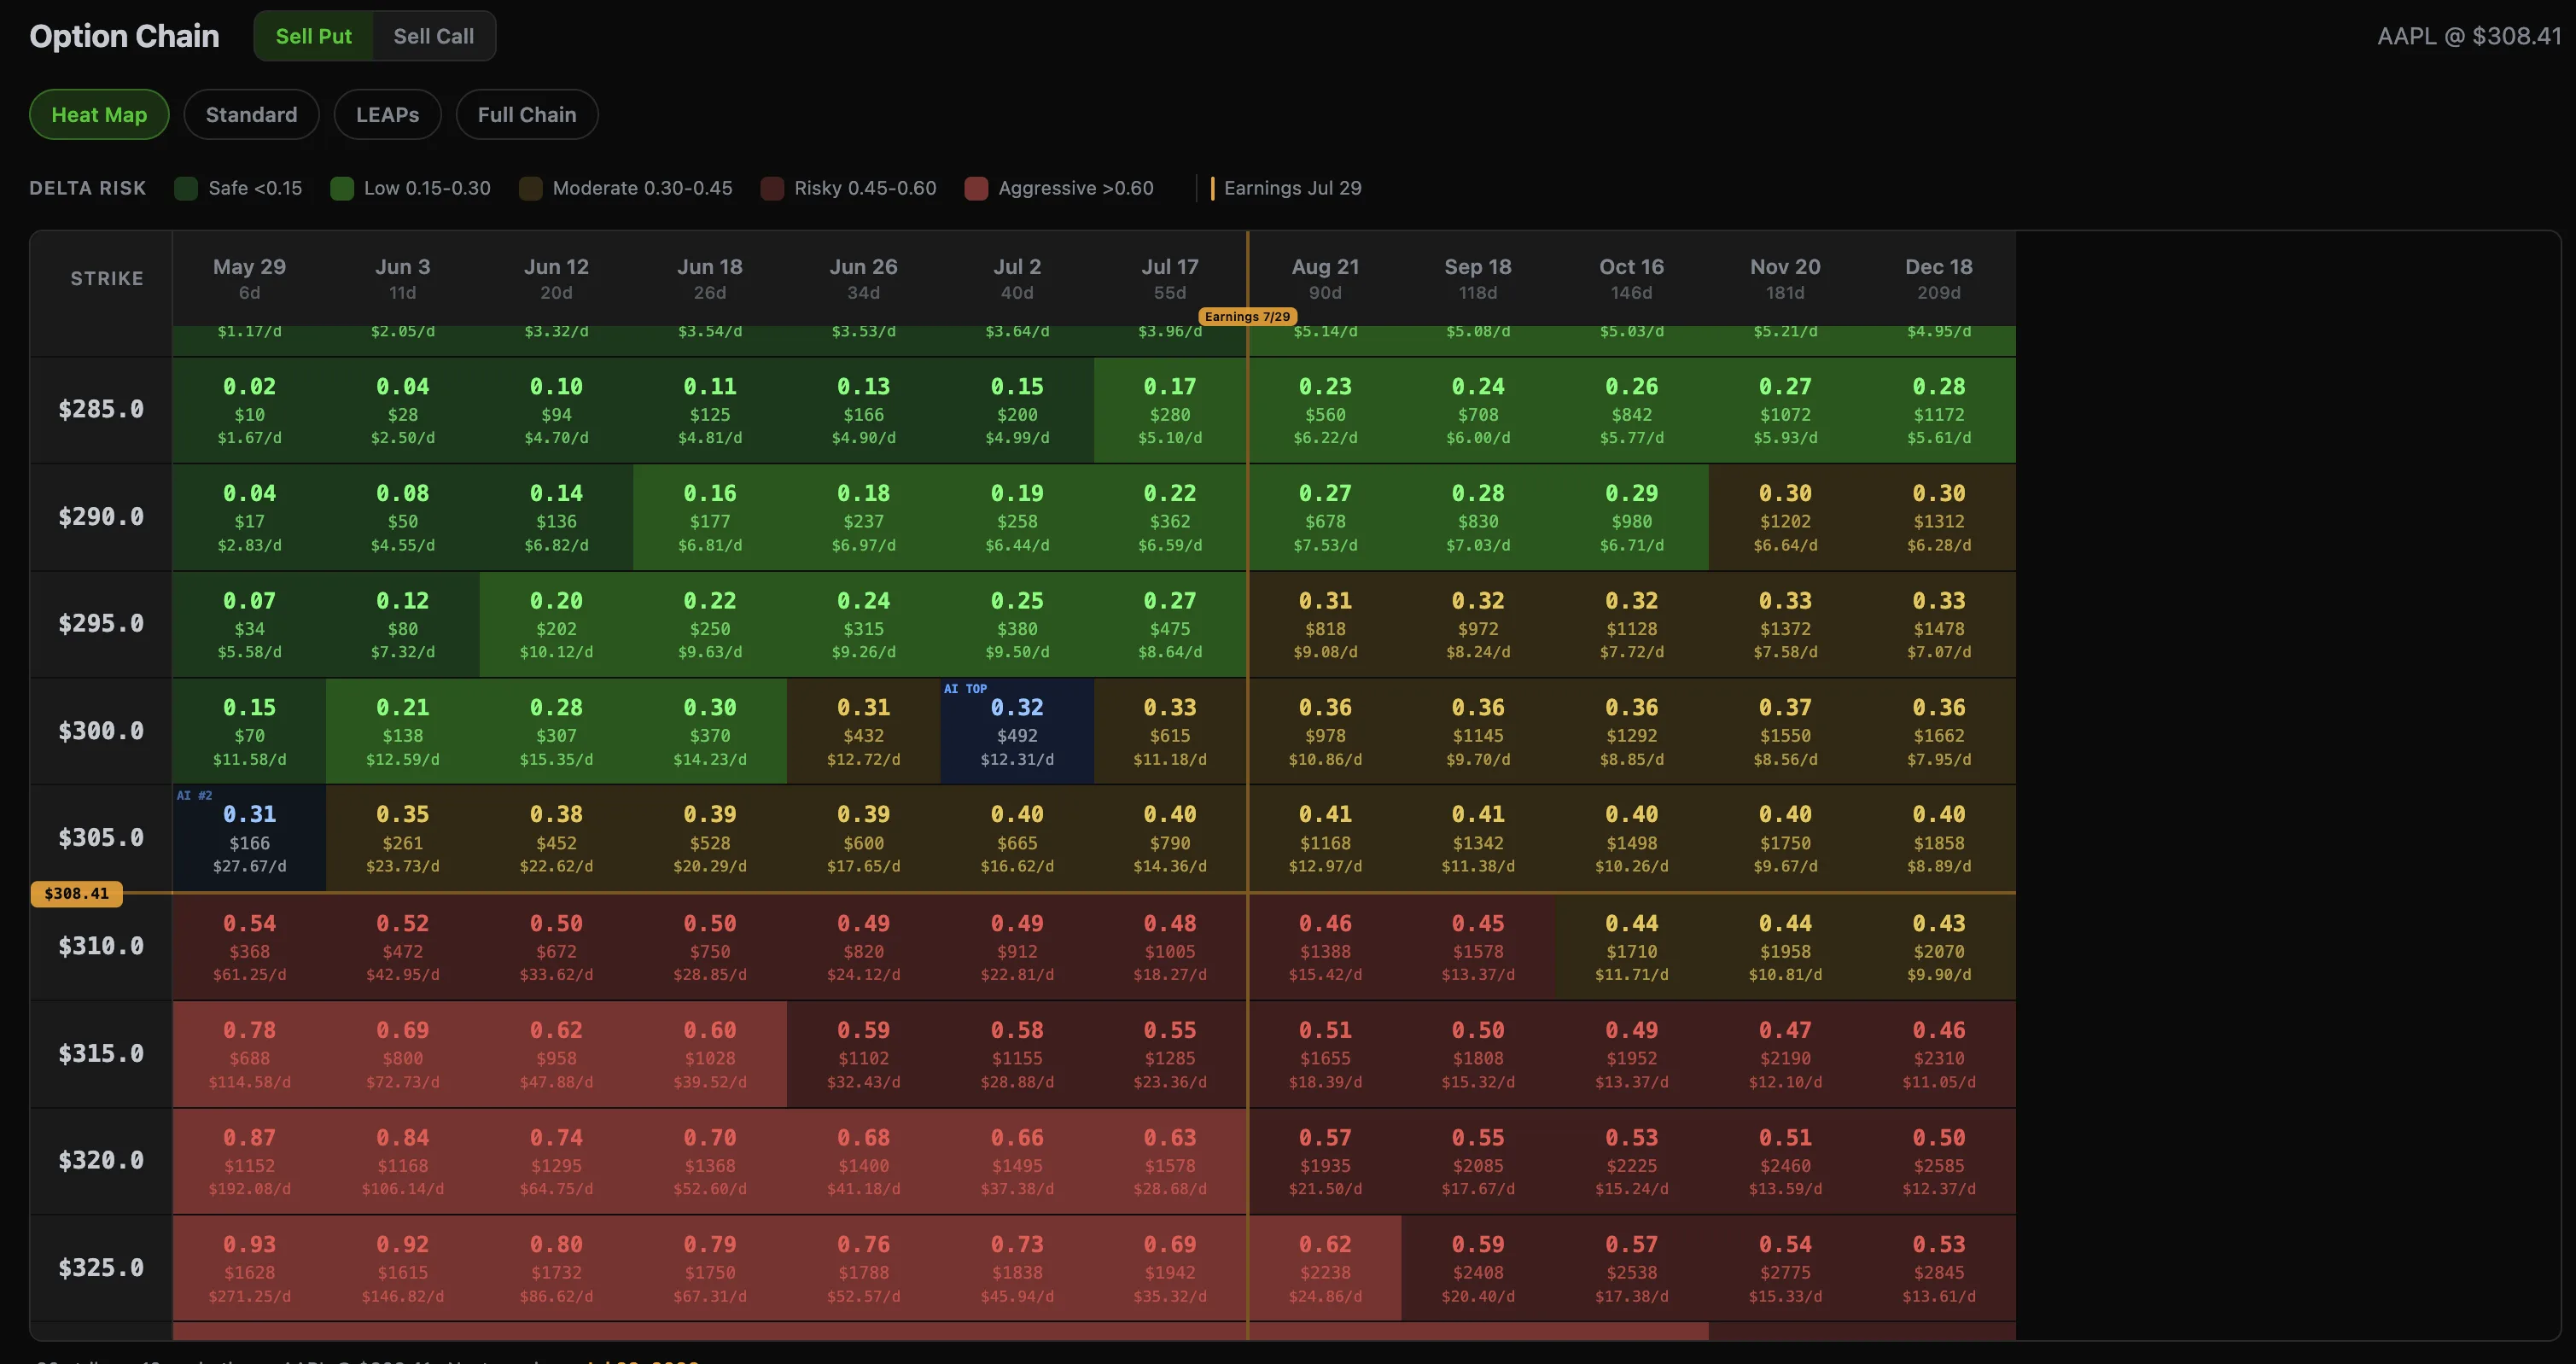
Everything you need, one screen
Each cell packs the data that matters to premium sellers.
Delta at a Glance
Five color tiers from deep green to deep red show you exactly how much directional risk each contract carries. No mental math required.
Daily Theta Income
Every cell shows $/day — the premium you'd collect per day if you sold that contract. Compare income potential across the entire surface instantly.
Earnings Overlay
Upcoming earnings dates appear as a subtle marker between expiration columns. Know exactly which contracts cross an earnings event before you trade.
Let AI pick from the full surface
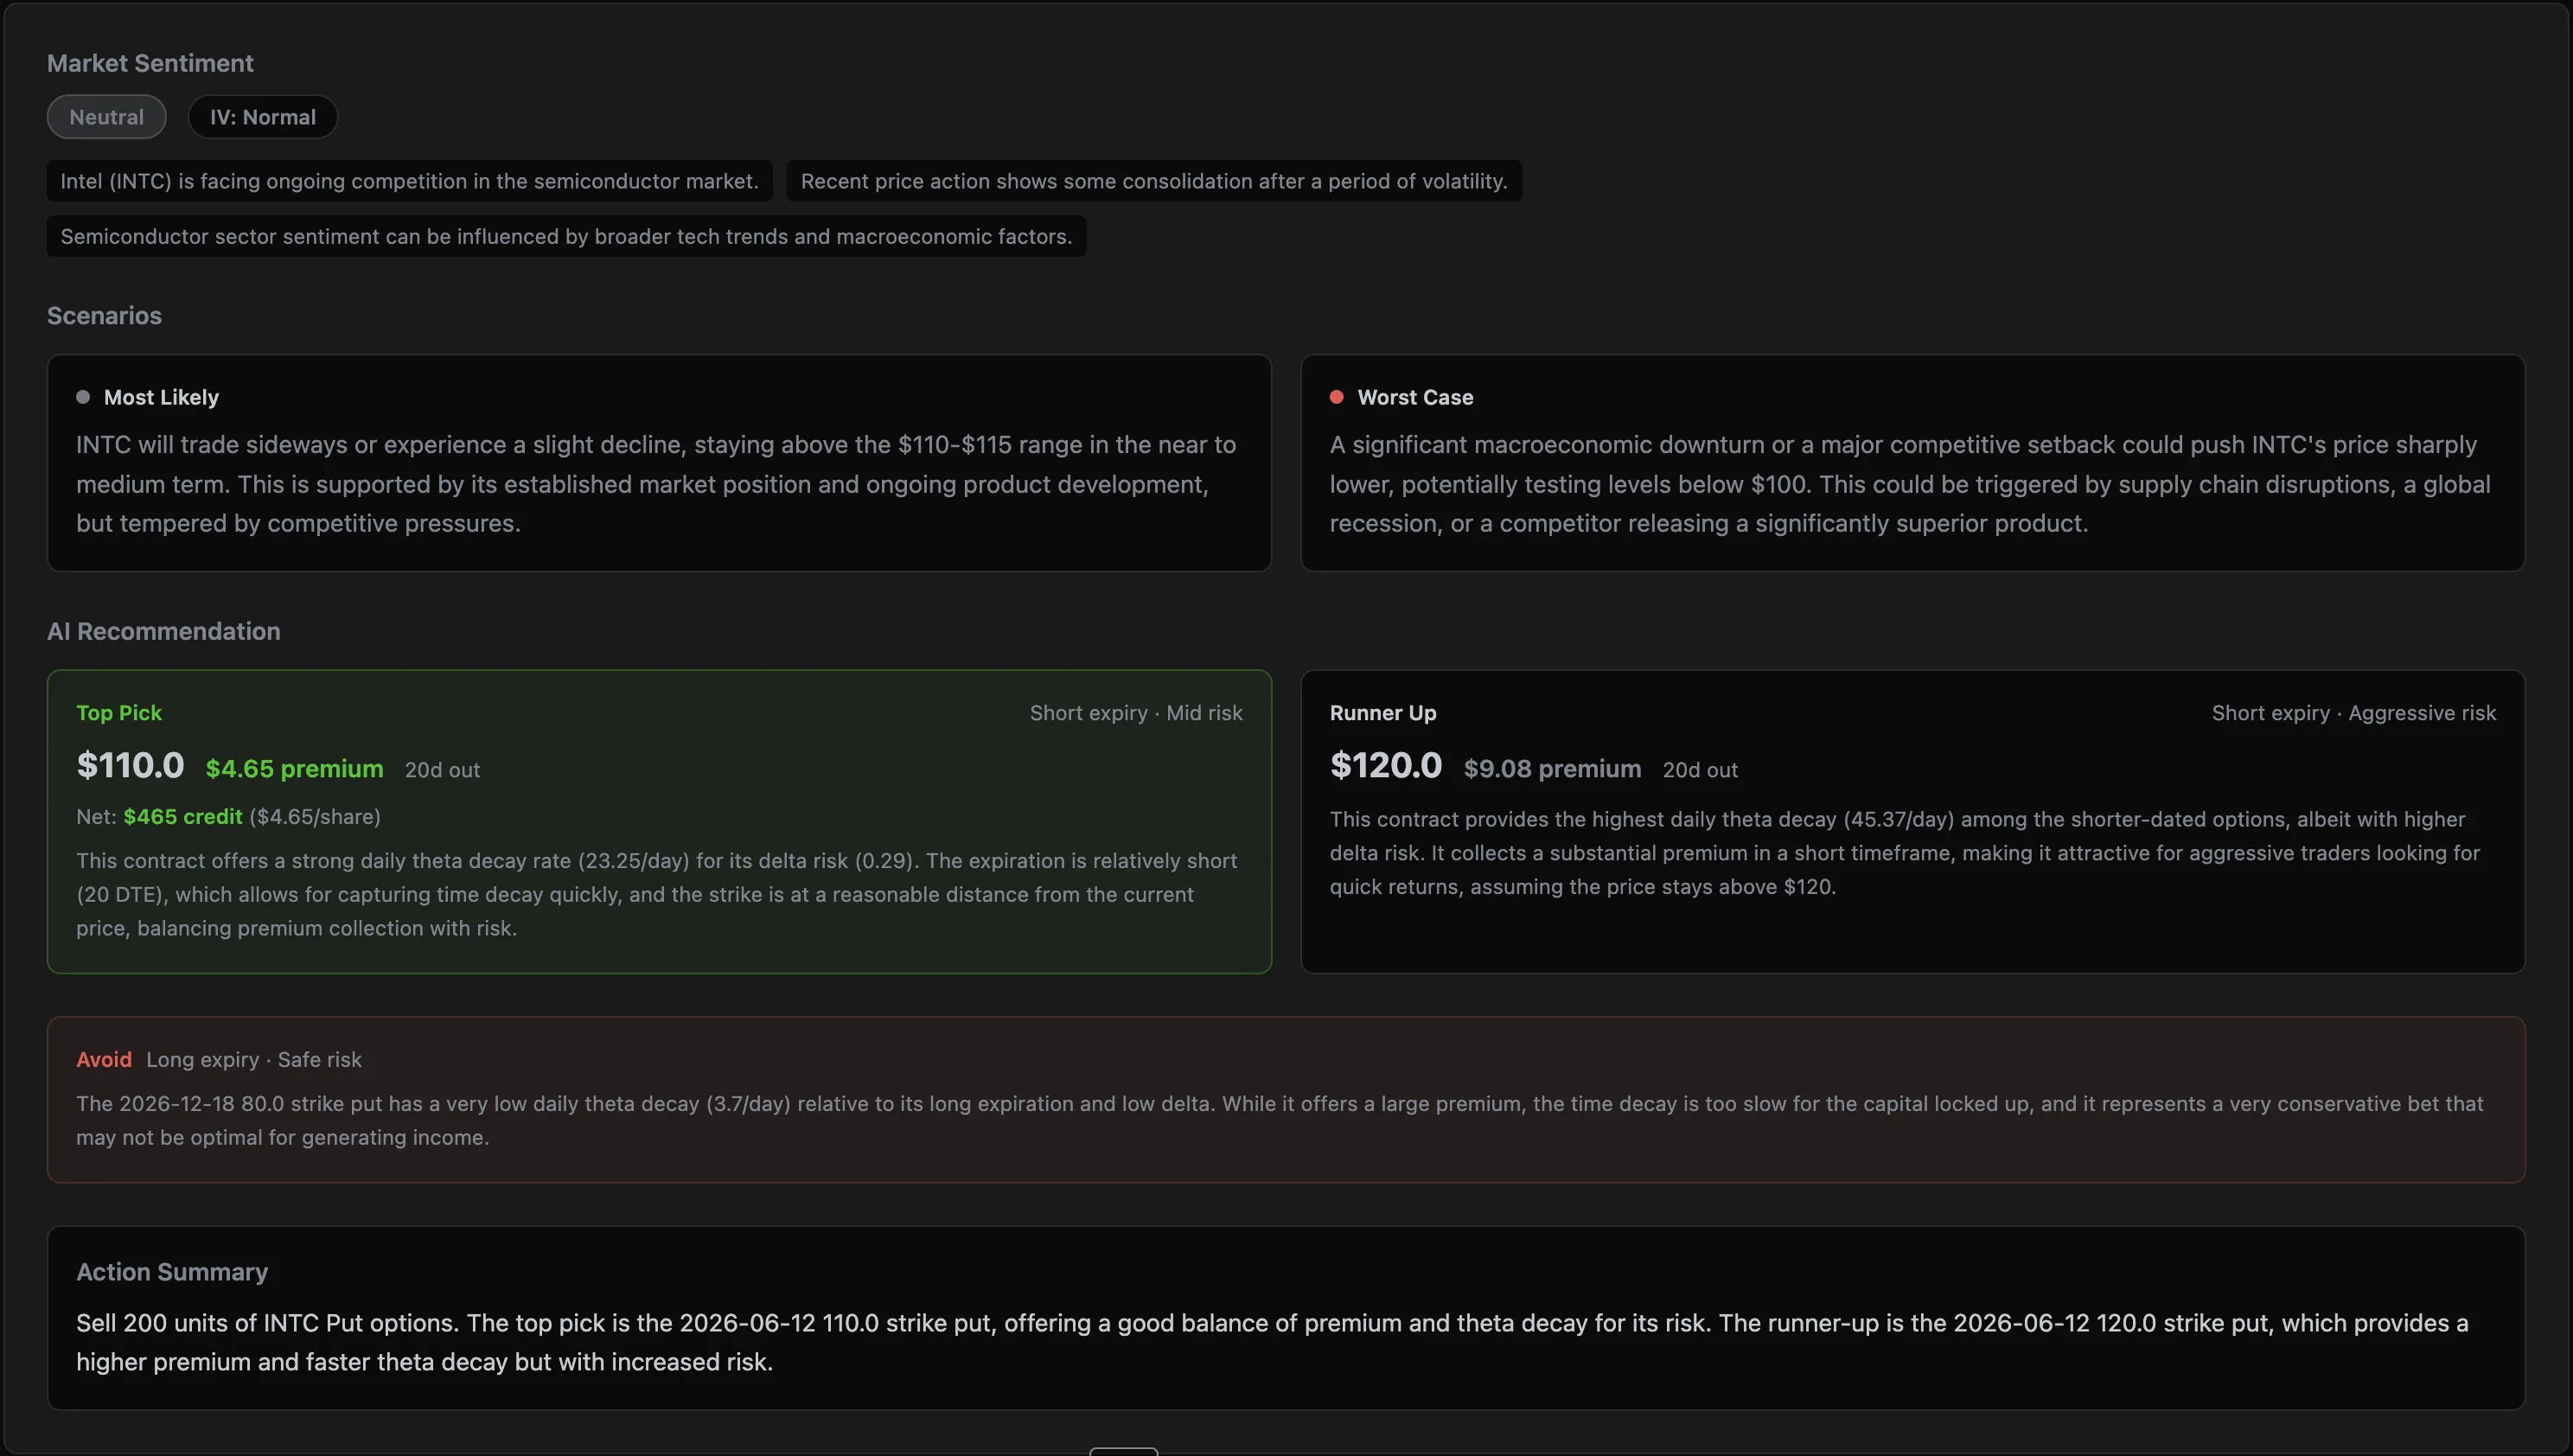
One click sends every contract on your heat map to AI for analysis. It evaluates delta risk, theta decay rate, market sentiment, and upcoming catalysts — then highlights its top pick and runner-up directly on the grid.
- •Analyzes contracts across all expirations and strikes simultaneously
- •Weighs theta income per day against delta risk
- •Factors in current market sentiment and upcoming events
- •Top pick and runner-up highlighted with blue outlines on the grid
- •Full reasoning provided — not just a pick, but why
$275 Put · Jun 26 · 34 DTE
$19.04/day · 0.37 delta · Strong theta with manageable risk
$280 Put · Jun 18 · 26 DTE
$13.46/day · 0.28 delta · Lower risk, faster decay
Built for the way you actually trade
Smart Date Spacing
The heat map selects up to 12 expirations spread across time — not seven daily expiries crammed into the same week. You see the near-term weeklies and the monthlies further out, giving you the full picture without the noise.
Clean Strike Grid
Half-dollar strikes that only exist in weeklies get filtered out automatically. Every row in the grid has data across all expirations, so there are no gaps or missing cells. The result is a solid, scannable surface.
Hover for Full Greeks
Mouse over any cell to see the complete picture: delta, bid, ask, IV, theta, gamma, and vega. The tooltip appears instantly — no clicks, no popups, no page loads.
Current Price Marker
A subtle price line sits between the two strikes that bracket the current stock price, with the exact price labeled. The grid auto-scrolls to center on this line when you open it, so you always start where the action is.
How it works
Pick a ticker
Search for any optionable stock. The heat map loads automatically with real-time greeks from Intrinio's options data feed.
Scan the surface
Scroll through strikes and expirations. Colors tell you the risk level, $/day shows you the income, and the earnings marker flags event risk.
Trade or ask AI
Found your contract? Great. Not sure? Hit the AI analysis button and let it evaluate the full surface for you.
Frequently Asked Questions
What does the options heat map show?
A grid of option contracts with expiration dates across the top and strike prices down the side. Each cell is color-coded by delta and shows the contract premium and daily theta income.
How is delta risk color-coded?
Five tiers: deep green (delta under 0.15), bright green (0.15-0.30), gold (0.30-0.45), light red (0.45-0.60), and deep red (above 0.60). Green means low directional risk, red means high.
What is the $/day figure?
The bid price times 100 divided by days to expiration. It tells you how much daily theta income you would earn if you sold that contract.
How does AI analysis work on the heat map?
ThetaPal samples contracts across the full surface and evaluates them for delta risk, theta decay, market conditions, and upcoming events. It highlights a top pick and runner-up with blue outlines on the grid.
Does it show earnings dates?
Yes. An amber marker appears between expiration columns when an earnings date falls in that range, or the column header is highlighted if earnings lands on an expiration date.