Know where dealers hedge. Trade with the flow.
Gamma exposure shows you where market makers are positioned at every strike. When dealers are long gamma they dampen moves. When they're short, they amplify them. See it in one chart.
The data that drives institutional options desks
GEX turns the options chain into a map of where market makers are forced to hedge.
Gamma Regime
Instantly know if you're in a positive or negative gamma environment. Positive GEX dampens volatility as dealers buy dips and sell rallies. Negative GEX amplifies moves as dealers add fuel in both directions.
Key Strike Levels
Call walls, put walls, and the gamma flip strike are displayed as markers on the chart. These act as natural price magnets and resistance levels that institutional desks trade around every session.
GEX History
A rolling time-series shows how total net GEX and the flip level have shifted over the past 30 days. See when the regime changed and how price responded to the transition.
Read the market's structural setup at a glance
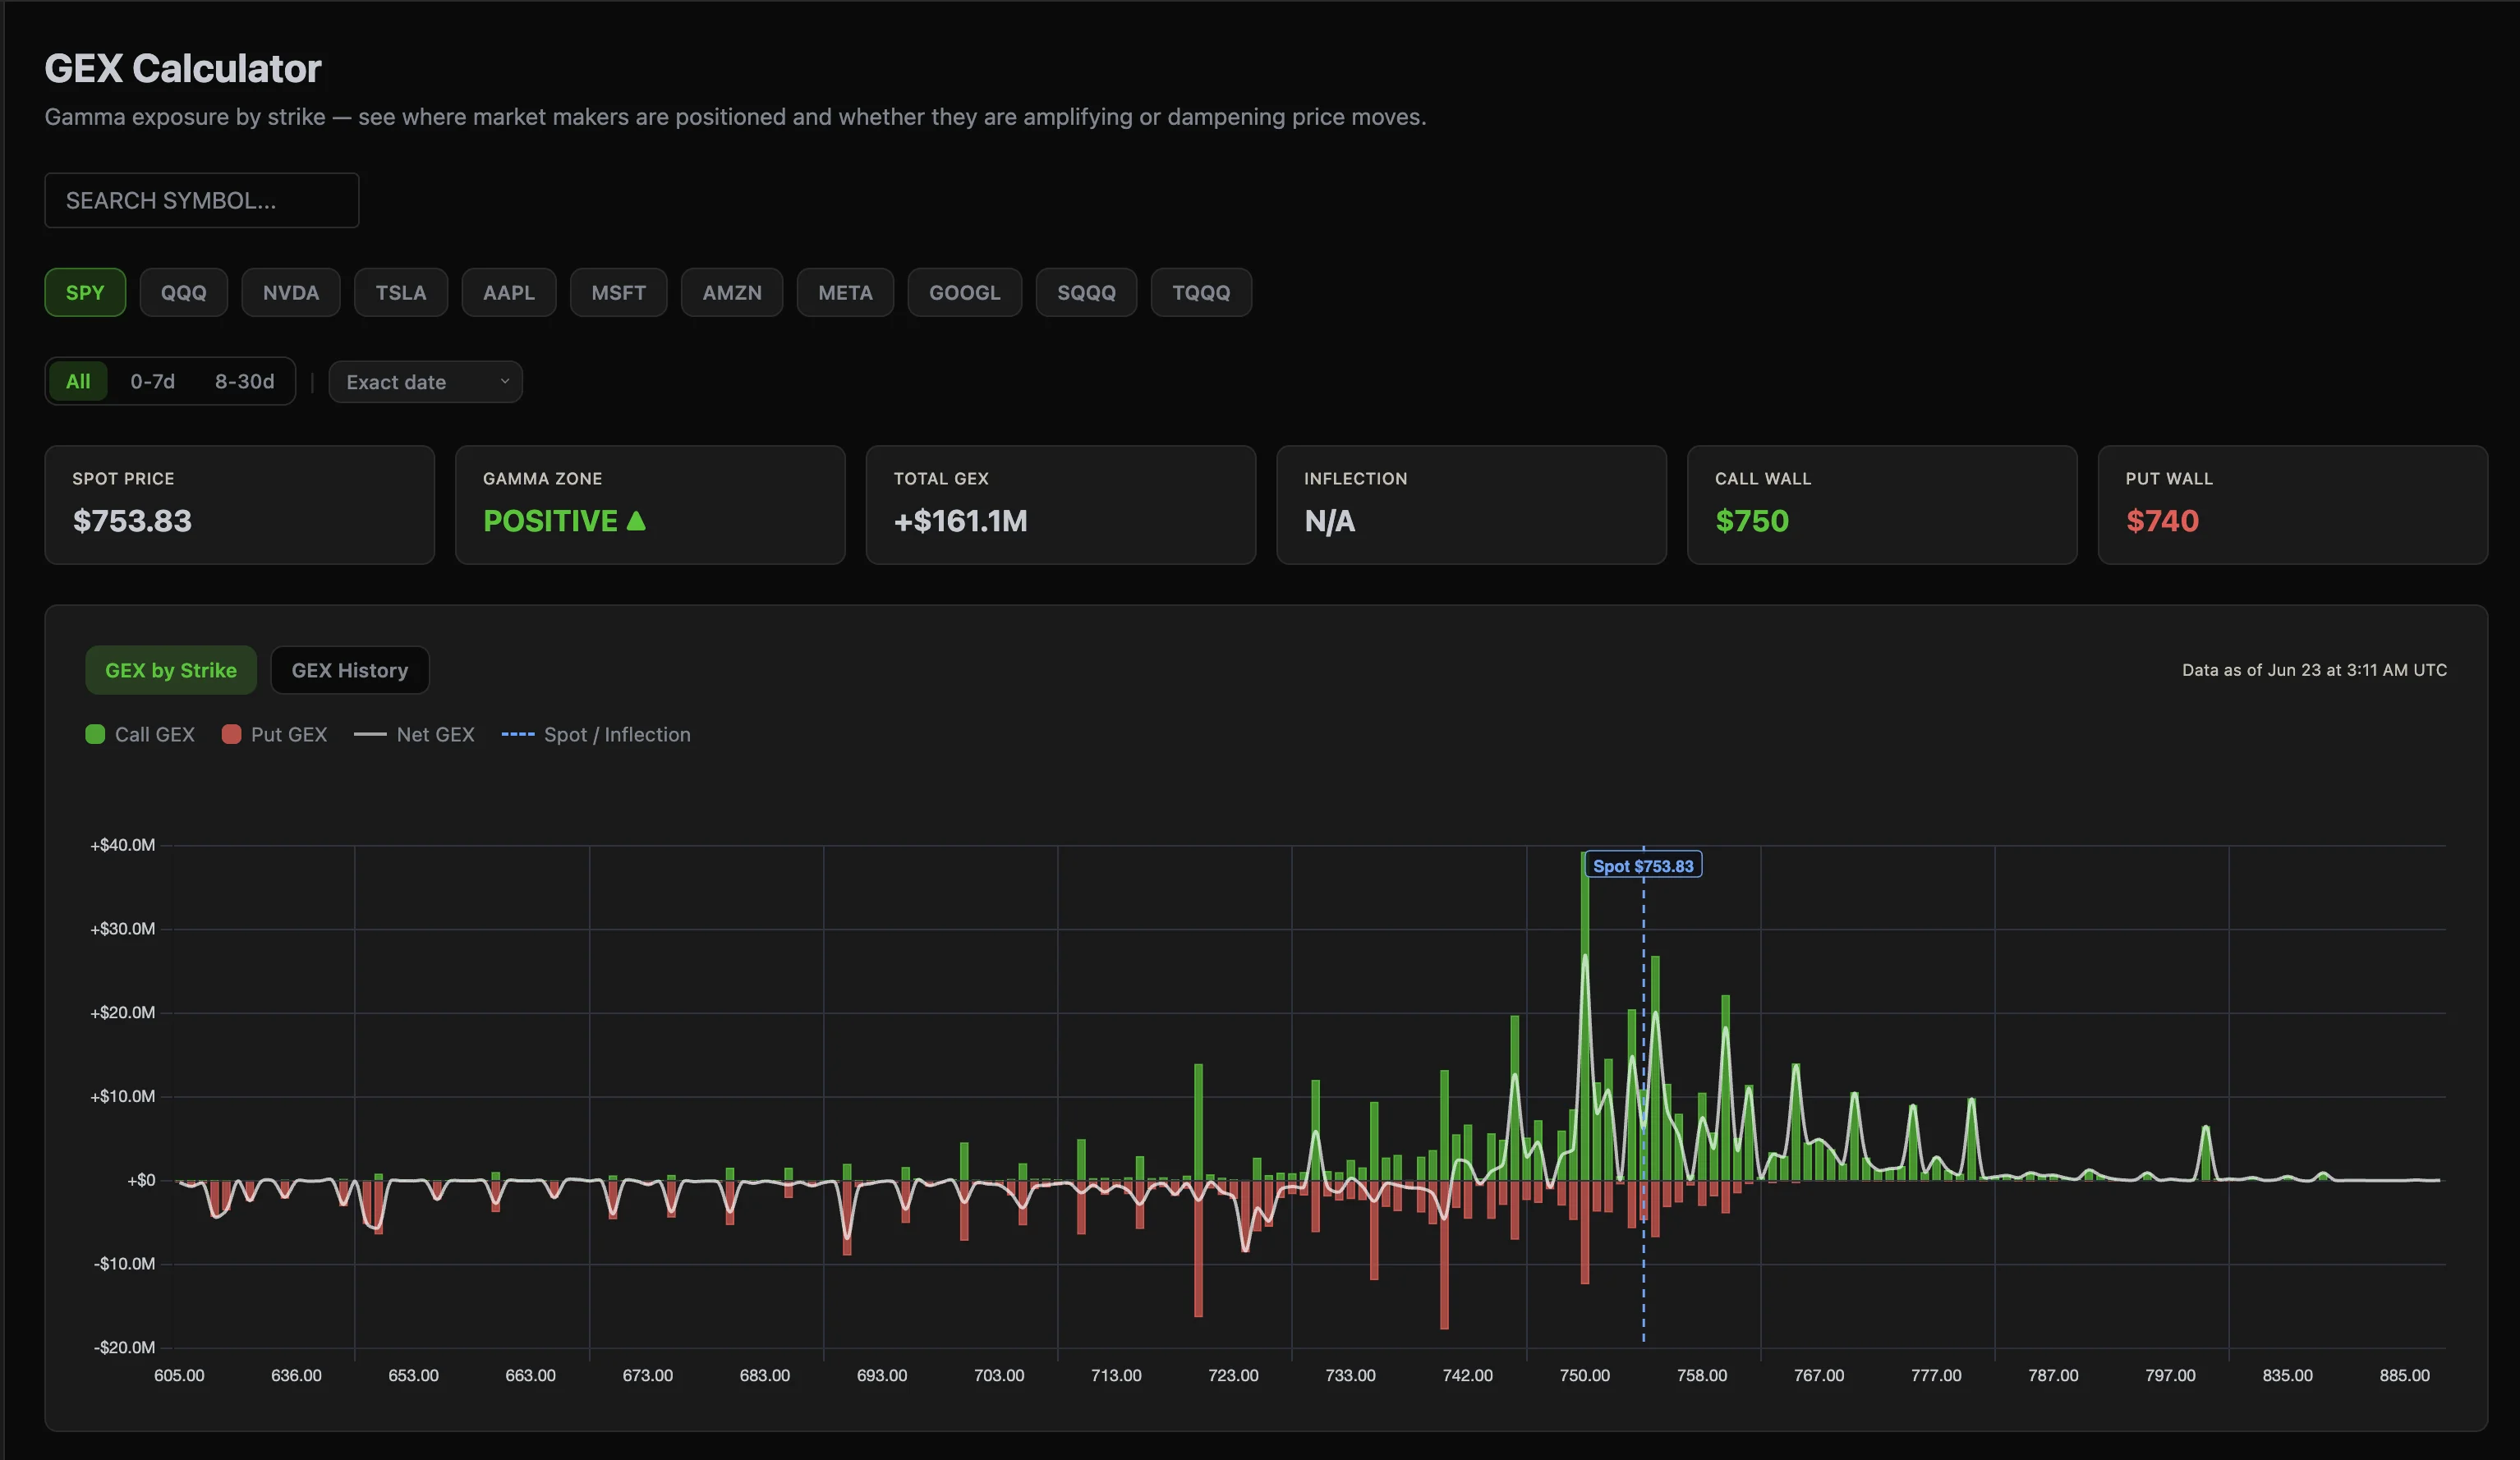
Every day the GEX chart updates with the prior session's closing open interest. Six key numbers tell you everything you need to know before the open: spot price, gamma zone, total net GEX, the gamma flip level, and the call and put walls.
- •Spot vs. flip: if spot is above the flip, dealers dampen moves. Below it, they amplify.
- •Call wall: the strike with peak call gamma — acts as a ceiling and price magnet.
- •Put wall: the strike with peak put gamma — acts as a floor and support level.
- •Total GEX: the magnitude tells you how strong the dampening or amplifying effect is.
- •Per-strike bars: green bars show call GEX, red bars show put GEX — see exactly where dealer exposure is concentrated.
Spot Price
$753.83
Gamma Zone
POSITIVE ▲
Total GEX
+$161.1M
Inflection
$740
Call Wall
$750
Put Wall
$740
GEX by Strike — SPY
Built for the tickers that matter
11 Major Tickers
SPY, QQQ, NVDA, TSLA, AAPL, MSFT, AMZN, META, GOOGL, SQQQ, and TQQQ. The most actively traded names where options open interest is deep enough for GEX to be most actionable and reliable.
DTE Filters
Slice the chain by expiration: all contracts, 0-7 DTE weekly gamma, or 8-30 DTE standard monthly. Isolate which expiration cycle is driving the current gamma regime without changing the flip level calculation.
Intraday Spot Price
Spot price refreshes every 30 minutes during market hours so the GEX chart shows where price sits relative to the call wall, put wall, and flip level in near real-time — not just at last night's close.
Flip Level Accuracy
The gamma flip is computed across the full option chain before any DTE filter is applied, so you always see the true whole-chain crossover — not an artifact of filtering to a single expiration cycle.
How it works
Pick a ticker
Choose from 11 major tickers including SPY, QQQ, NVDA, and TSLA. The GEX chart loads instantly with last night's EOD option chain data.
Read the chart
Green bars show where dealers are long calls. Red bars show put concentration. The net line and flip level show the balance point between dampening and amplifying regimes.
Trade with the flow
In positive GEX, range-bound strategies like iron condors benefit from dampened moves. In negative GEX, directional plays benefit from amplified momentum. Know your regime before you trade.
Frequently Asked Questions
What is gamma exposure (GEX)?
GEX measures the net gamma that market makers hold across all open option contracts. Dealers who sold options to retail traders must delta-hedge by trading the underlying — GEX shows the direction and magnitude of that forced hedging at every strike.
What does positive vs negative GEX mean?
Positive GEX means dealers are net long gamma and will buy dips and sell rallies to hedge, dampening volatility. Negative GEX means dealers are net short gamma and their hedging adds fuel to moves — rallies accelerate and selloffs deepen.
What is the gamma flip level?
The gamma flip (inflection point) is the strike where net dealer gamma crosses zero. Above it, the market is in a positive gamma regime. Below it, the regime is negative. Crossing the flip level is a significant event that often changes intraday price behavior.
What are call walls and put walls?
The call wall is the strike with the highest call gamma concentration — dealers must sell the underlying here to hedge, creating resistance. The put wall is the mirror: the strike with peak put gamma, where dealers must buy, creating support.
How current is ThetaPal's GEX data?
GEX levels are computed from the prior night's end-of-day open interest, so the strike structure is accurate as of the last close. Spot price updates every 30 minutes during market hours, so you can see where price sits relative to the static GEX levels in near real-time.