See ThetaPal in action
Walk through every feature of the platform. From tracking your open positions to monitoring insider trades, here's everything ThetaPal does for you.
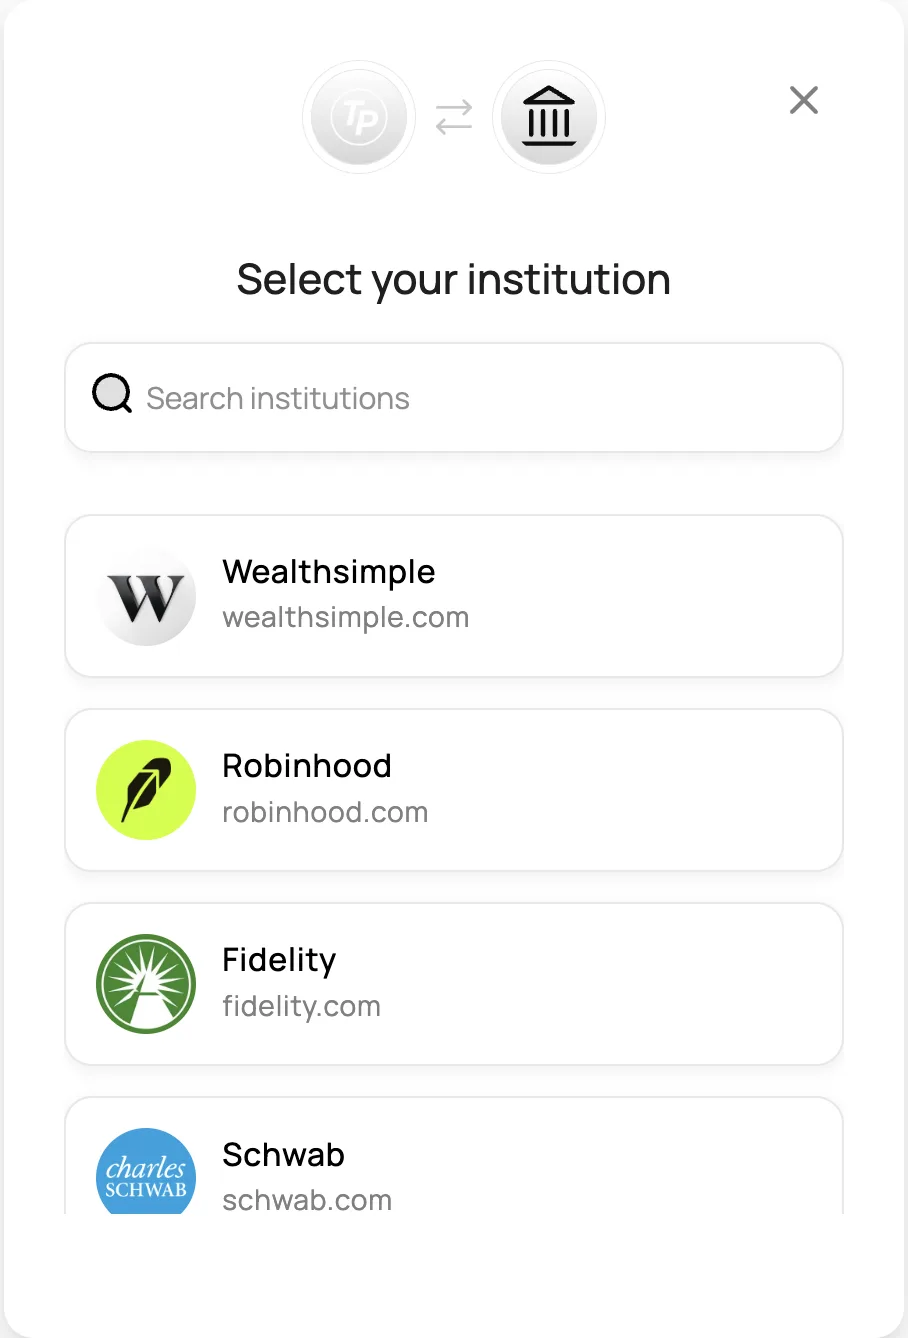
Connect your brokerage
Link your brokerage account in seconds through SnapTrade's secure integration. Search for your institution and authorize a read-only connection — ThetaPal never has access to place trades on your behalf.
- •Schwab, Fidelity, Robinhood, E-Trade, and more
- •Powered by SnapTrade's bank-level security
- •Positions and trade history sync automatically
- •Read-only access
- •Trading support may be added in the future
Supported Brokerages
 Schwab
 Fidelity
 Robinhood
 E-Trade
 Vanguard
 Chase
Chase
 Wells Fargo
 Webull
 tastytrade
 Interactive Brokers
 Coinbase
 Public
 Wealthsimple
 eToro
eToro
 Moomoo
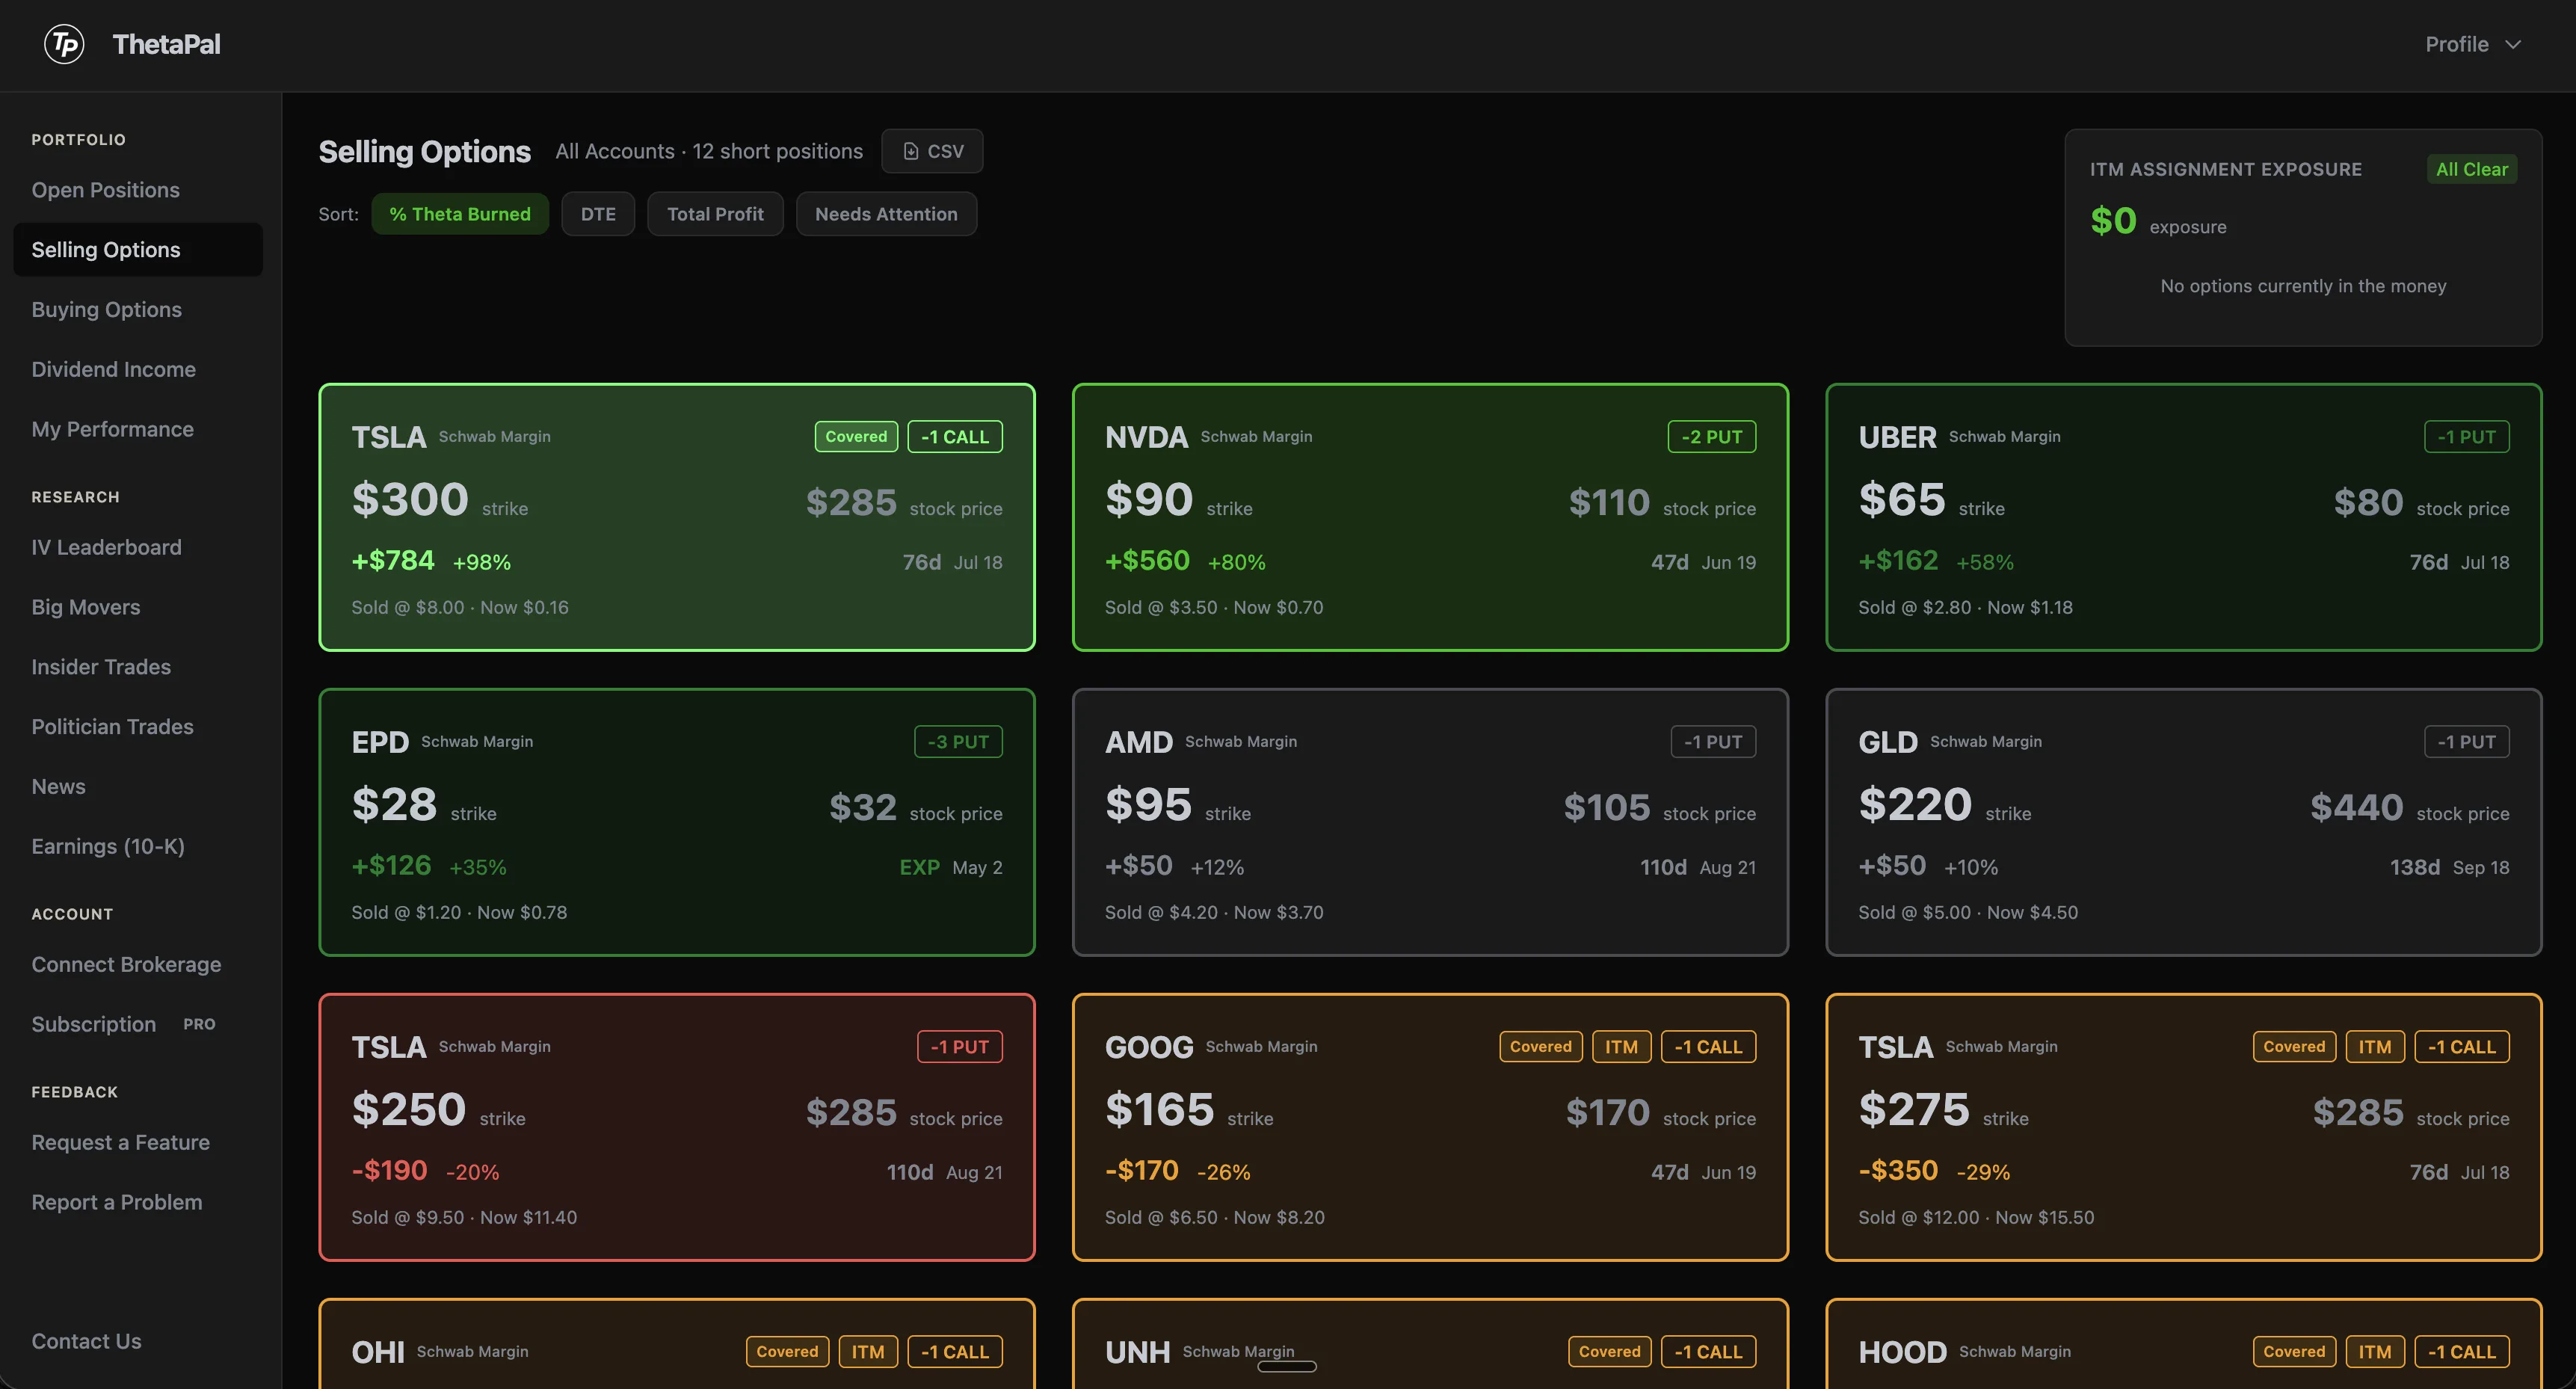
Wheel analysis visualized
Every short option is a color-coded tile. Green means you're winning, red means it needs attention. Your entire options book on one screen.
- •Strike price vs current stock price side-by-side
- •P&L in dollars and percentage
- •Days to expiration and expiry date
- •Entry price vs current option price
- •ITM warnings for positions at risk

Sort by theta burned, DTE, total profit, or surface the positions that need your attention first.
Quickly assess all positions
Every option you sell becomes a color-coded tile. No more digging through broker tables or spreadsheets to figure out what needs action.
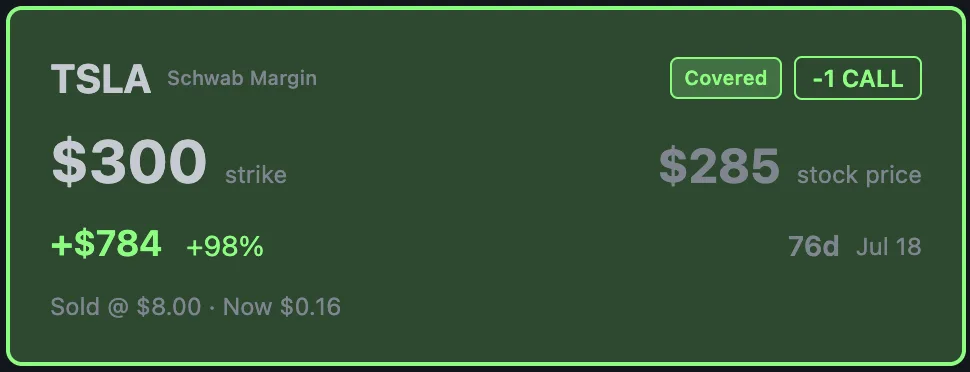
Green — Take Profit
This TSLA covered call has burned 98% of its premium. The deep green border says it all: close the winner and redeploy your capital into the next trade.
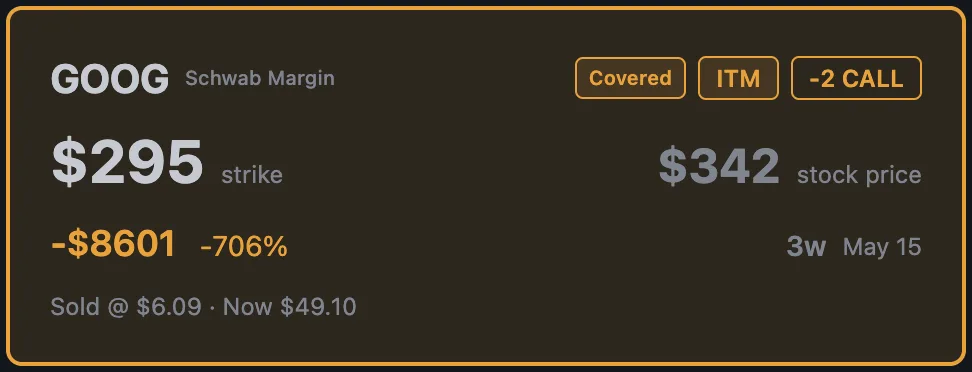
Amber — Gains Capped
This covered call is deep ITM. The amber color instantly tells you this isn't a crisis — your shares will just be called away at the strike. The "Covered" and "ITM" badges confirm the situation without opening a single menu.
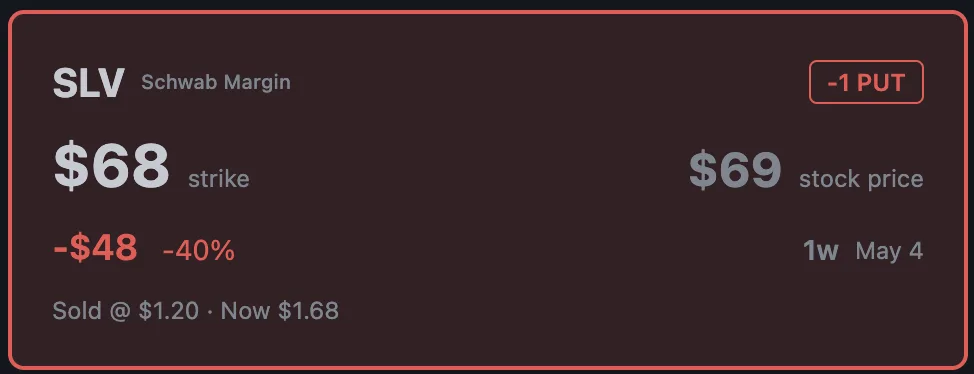
Red — Needs Attention
This put is losing money and the red border demands your attention. The stock is near the strike with little time left. Time to decide: roll it out, close for a small loss, or take assignment. The tile tells you everything you need to act.
Three colors. One glance. You know exactly which positions to celebrate, which to monitor, and which need action right now.
Click into any tile to go deeper
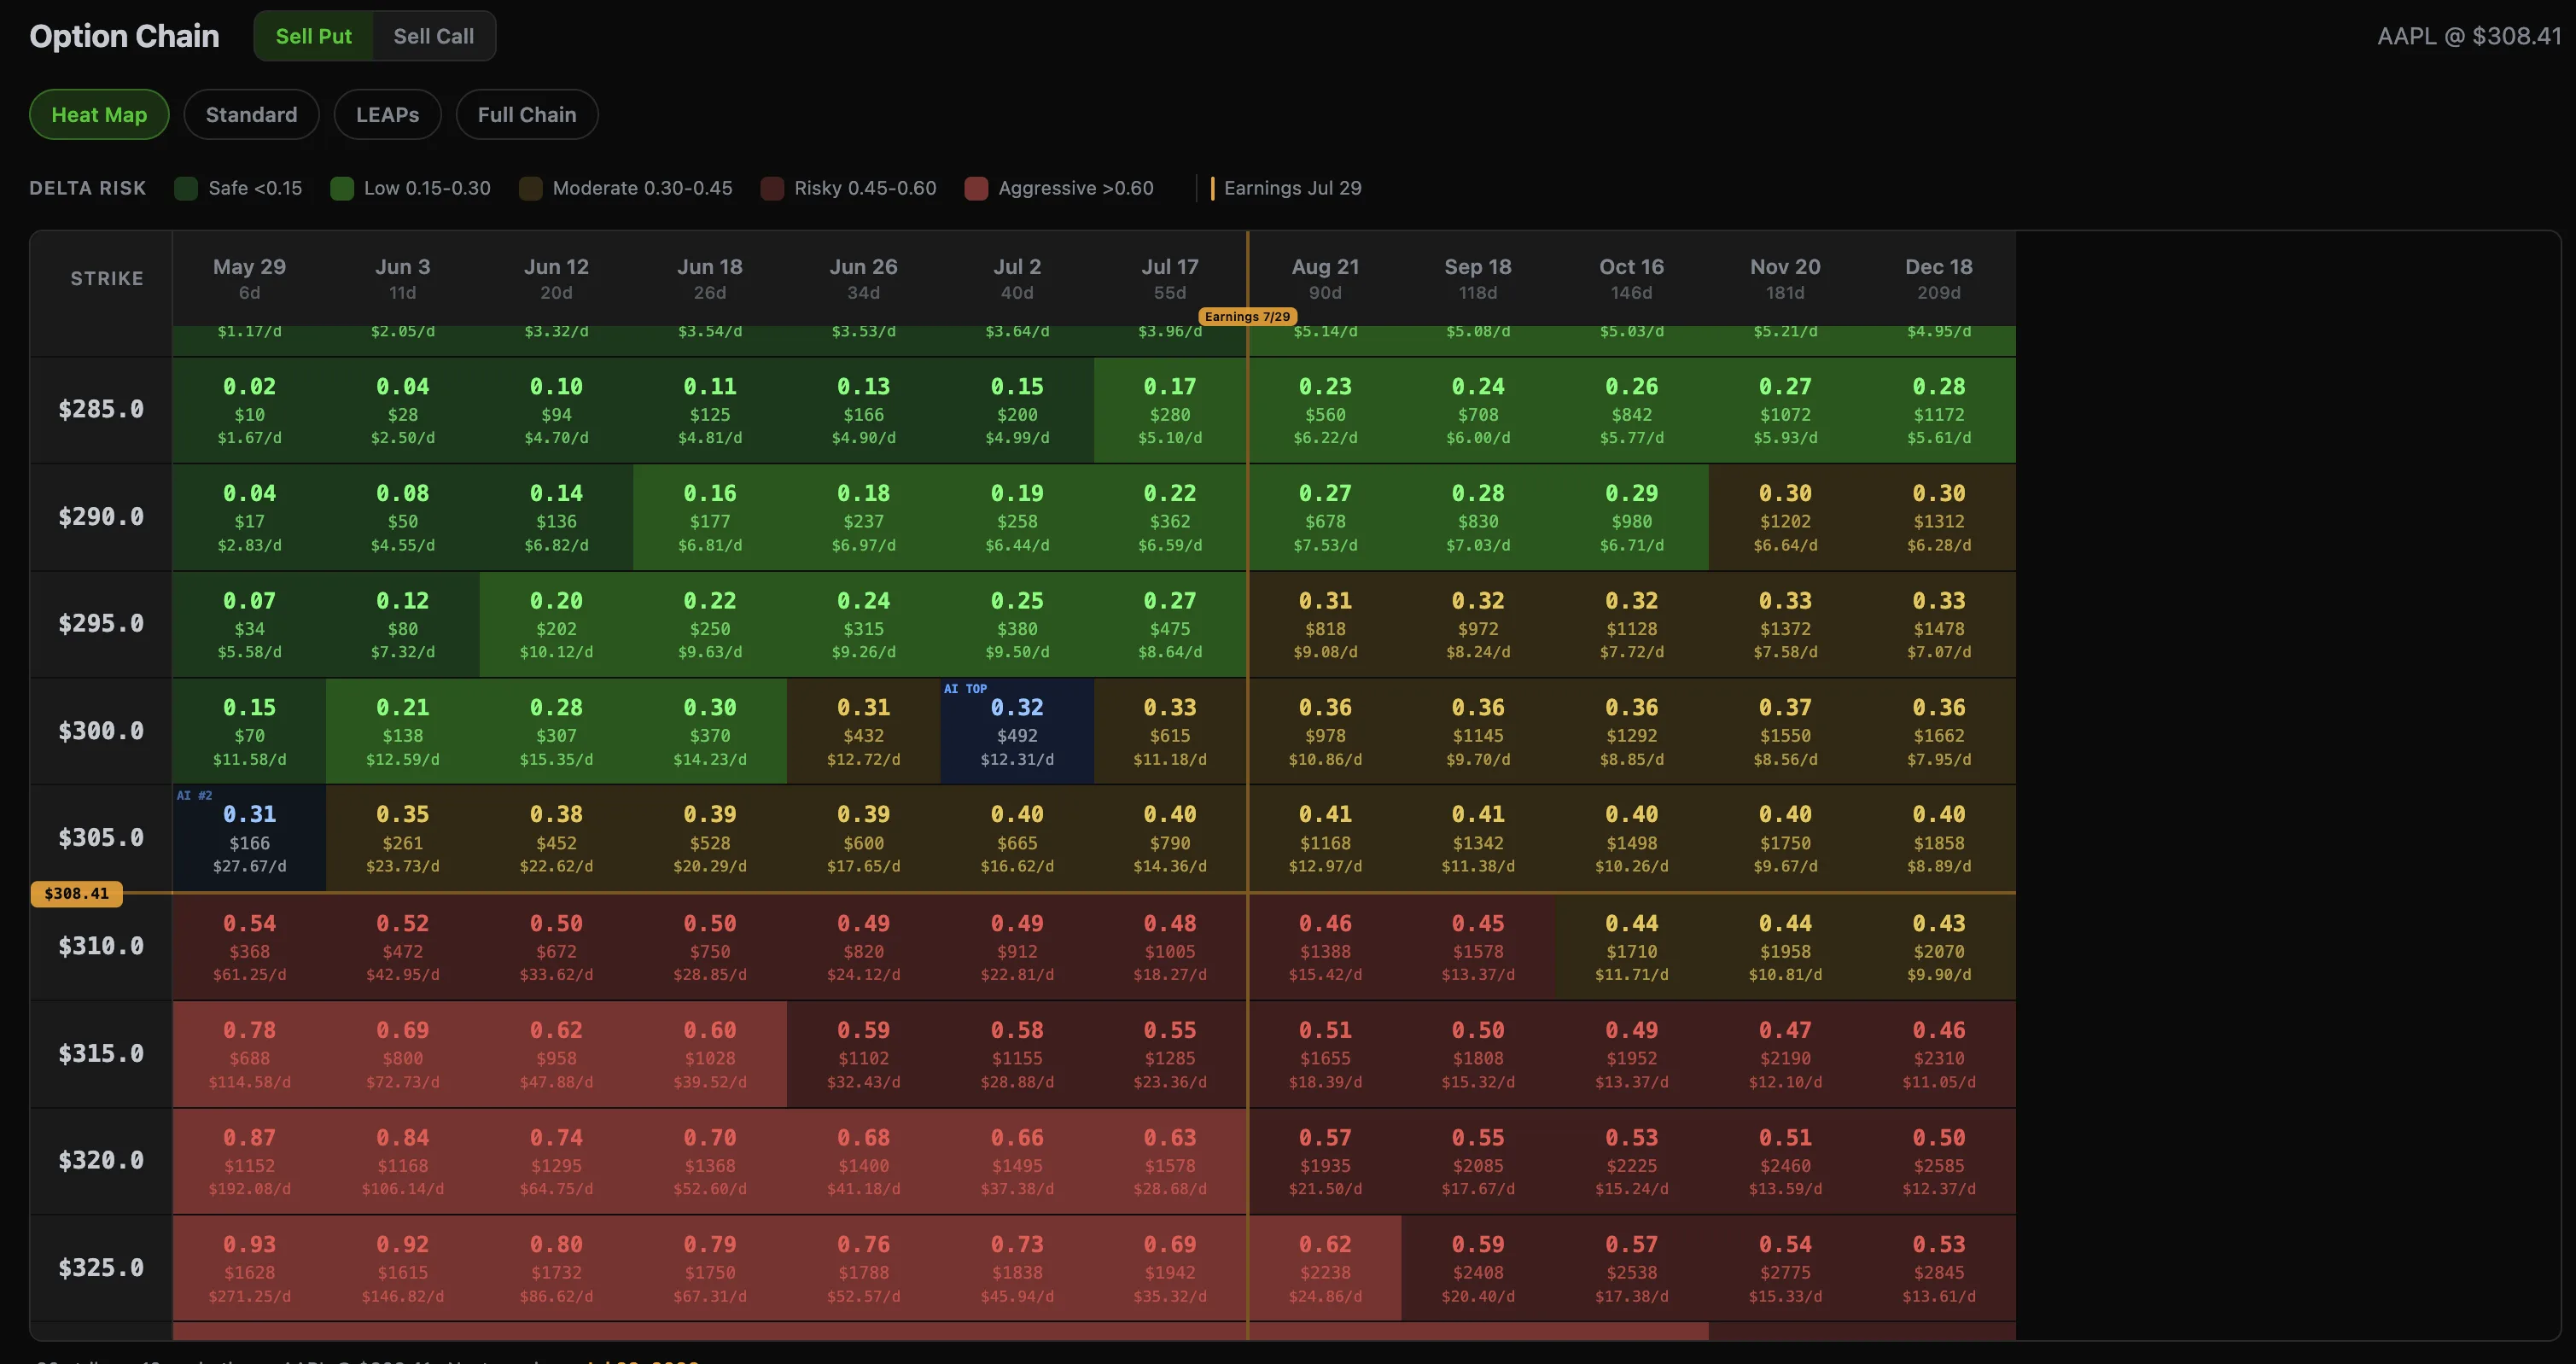
Best DTE and Strike
The options heatmap visualizes every strike and expiration at a glance — color-coded by expected profit so you can instantly spot the sweet spot. Find the best DTE and strike without scrolling through option chains.
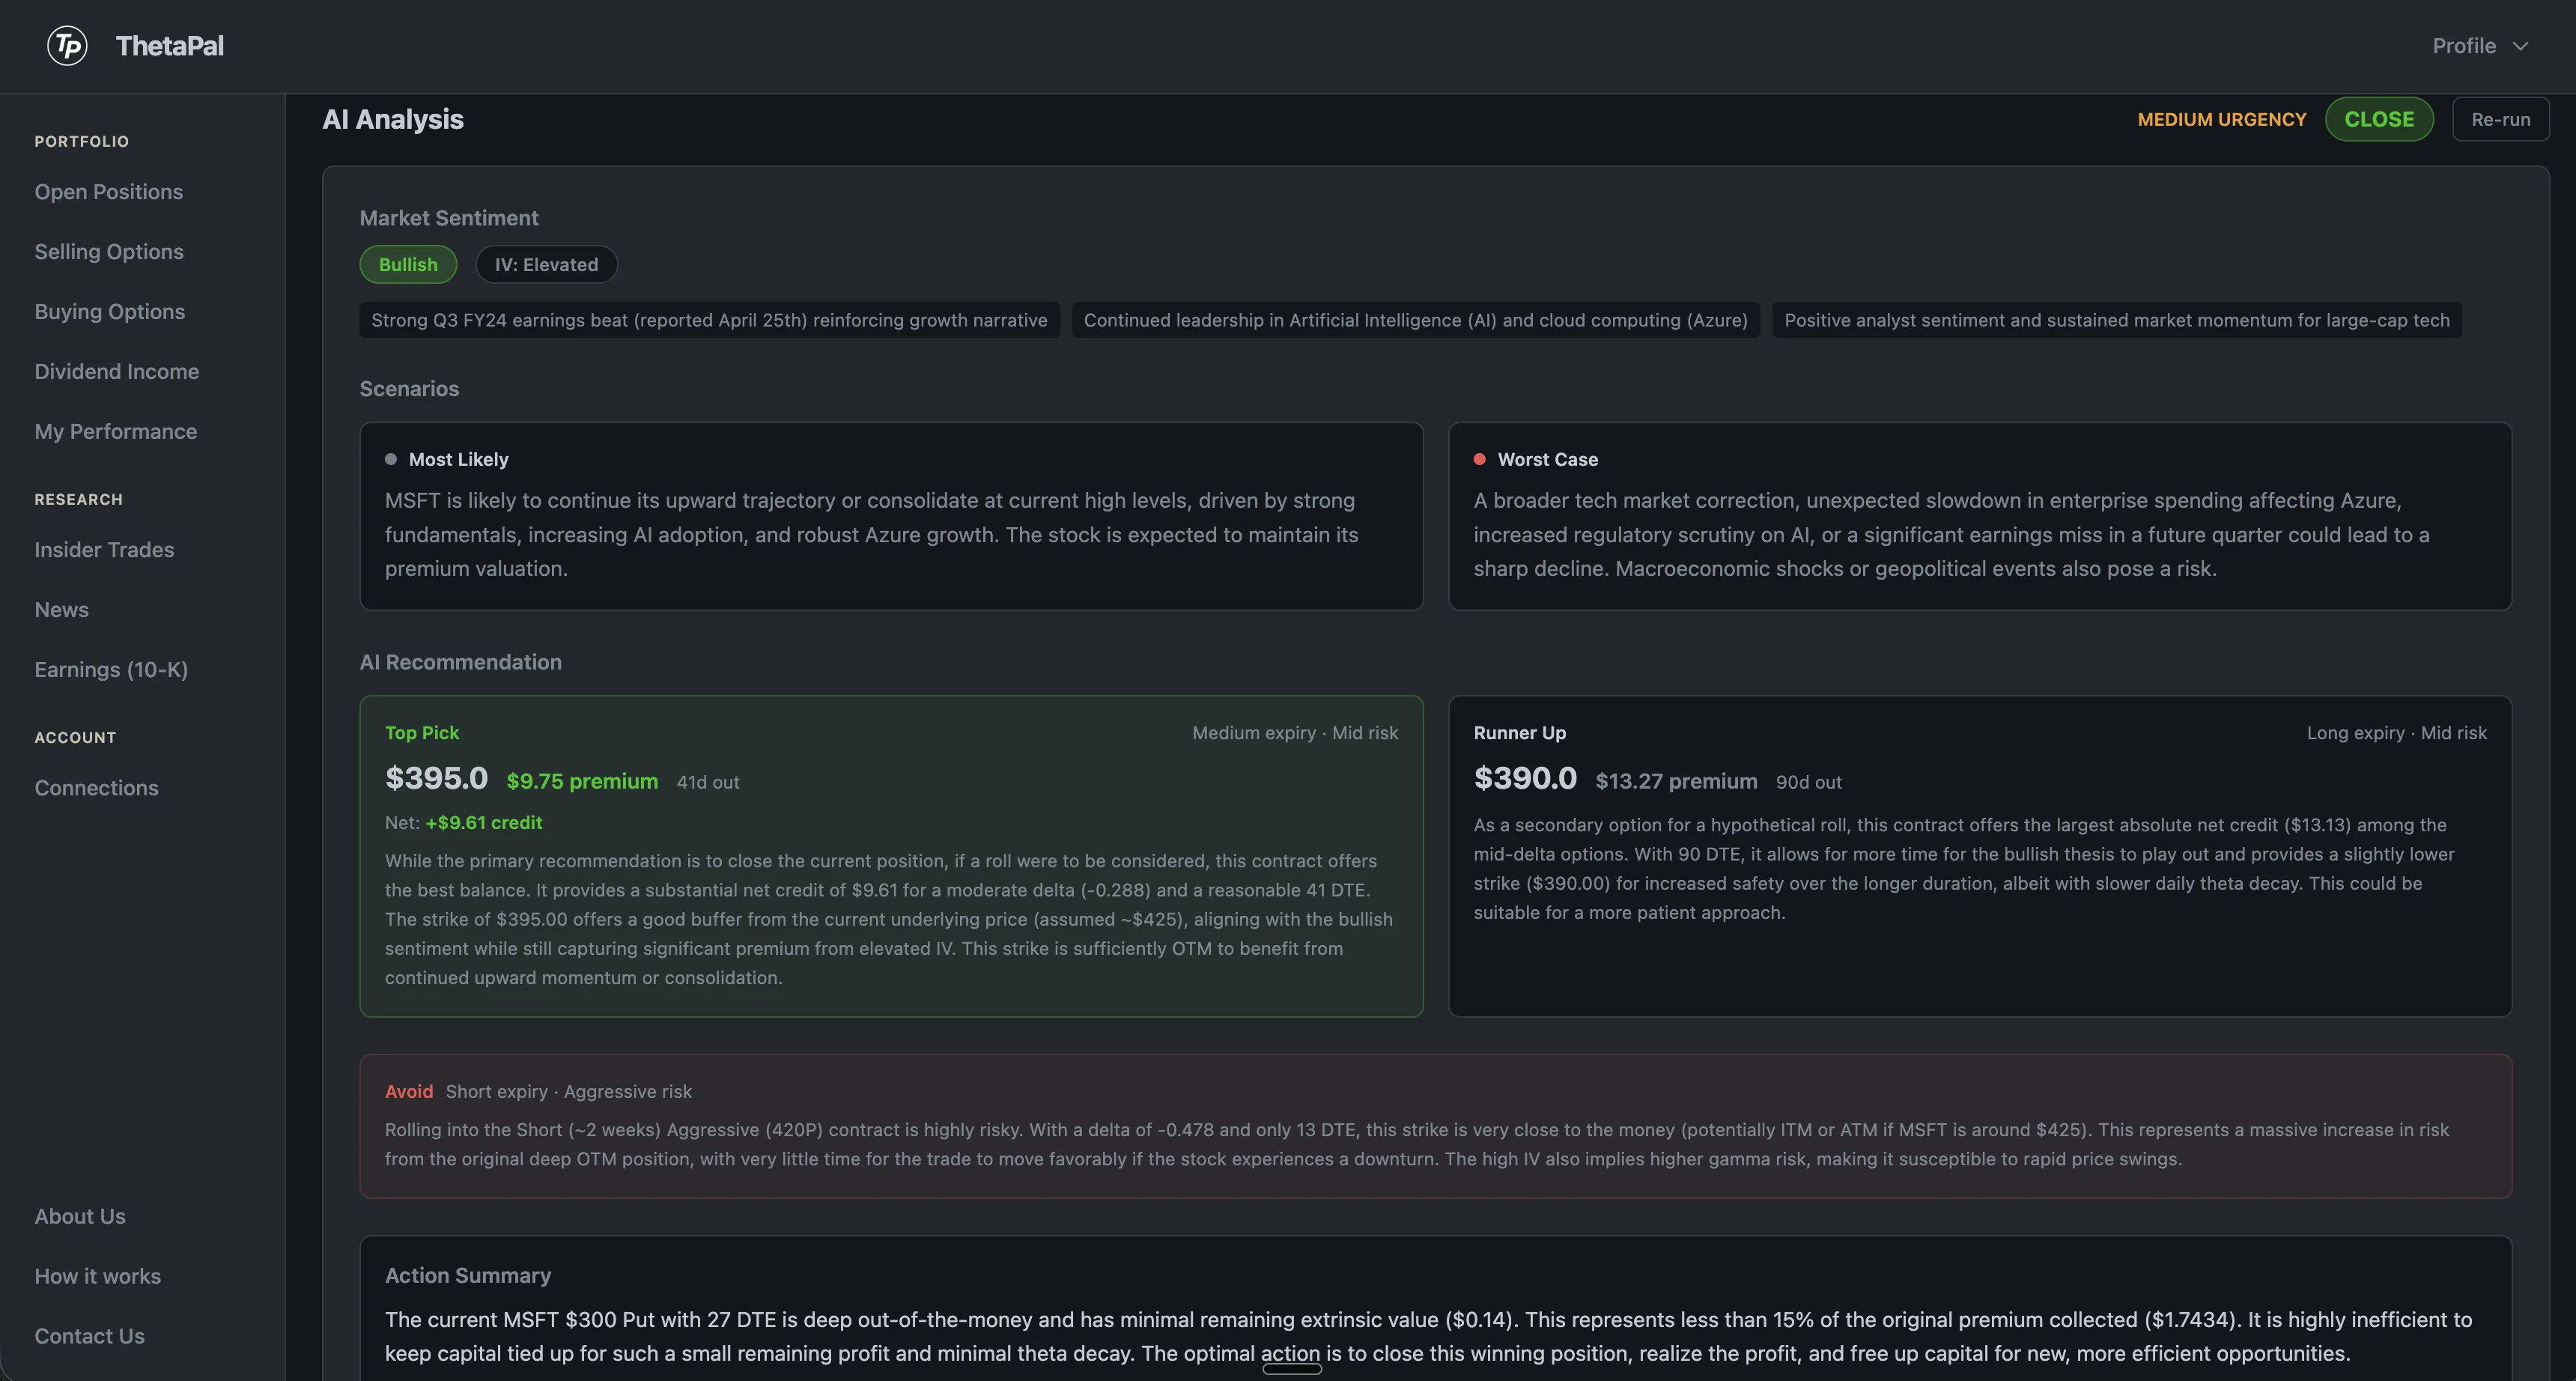
AI-powered analysis
Each position gets an AI-powered analysis with market sentiment, bull and bear scenarios, and a concrete recommendation — including the exact contract, net credit, and risk assessment. Confirm your instinct before you click trade.
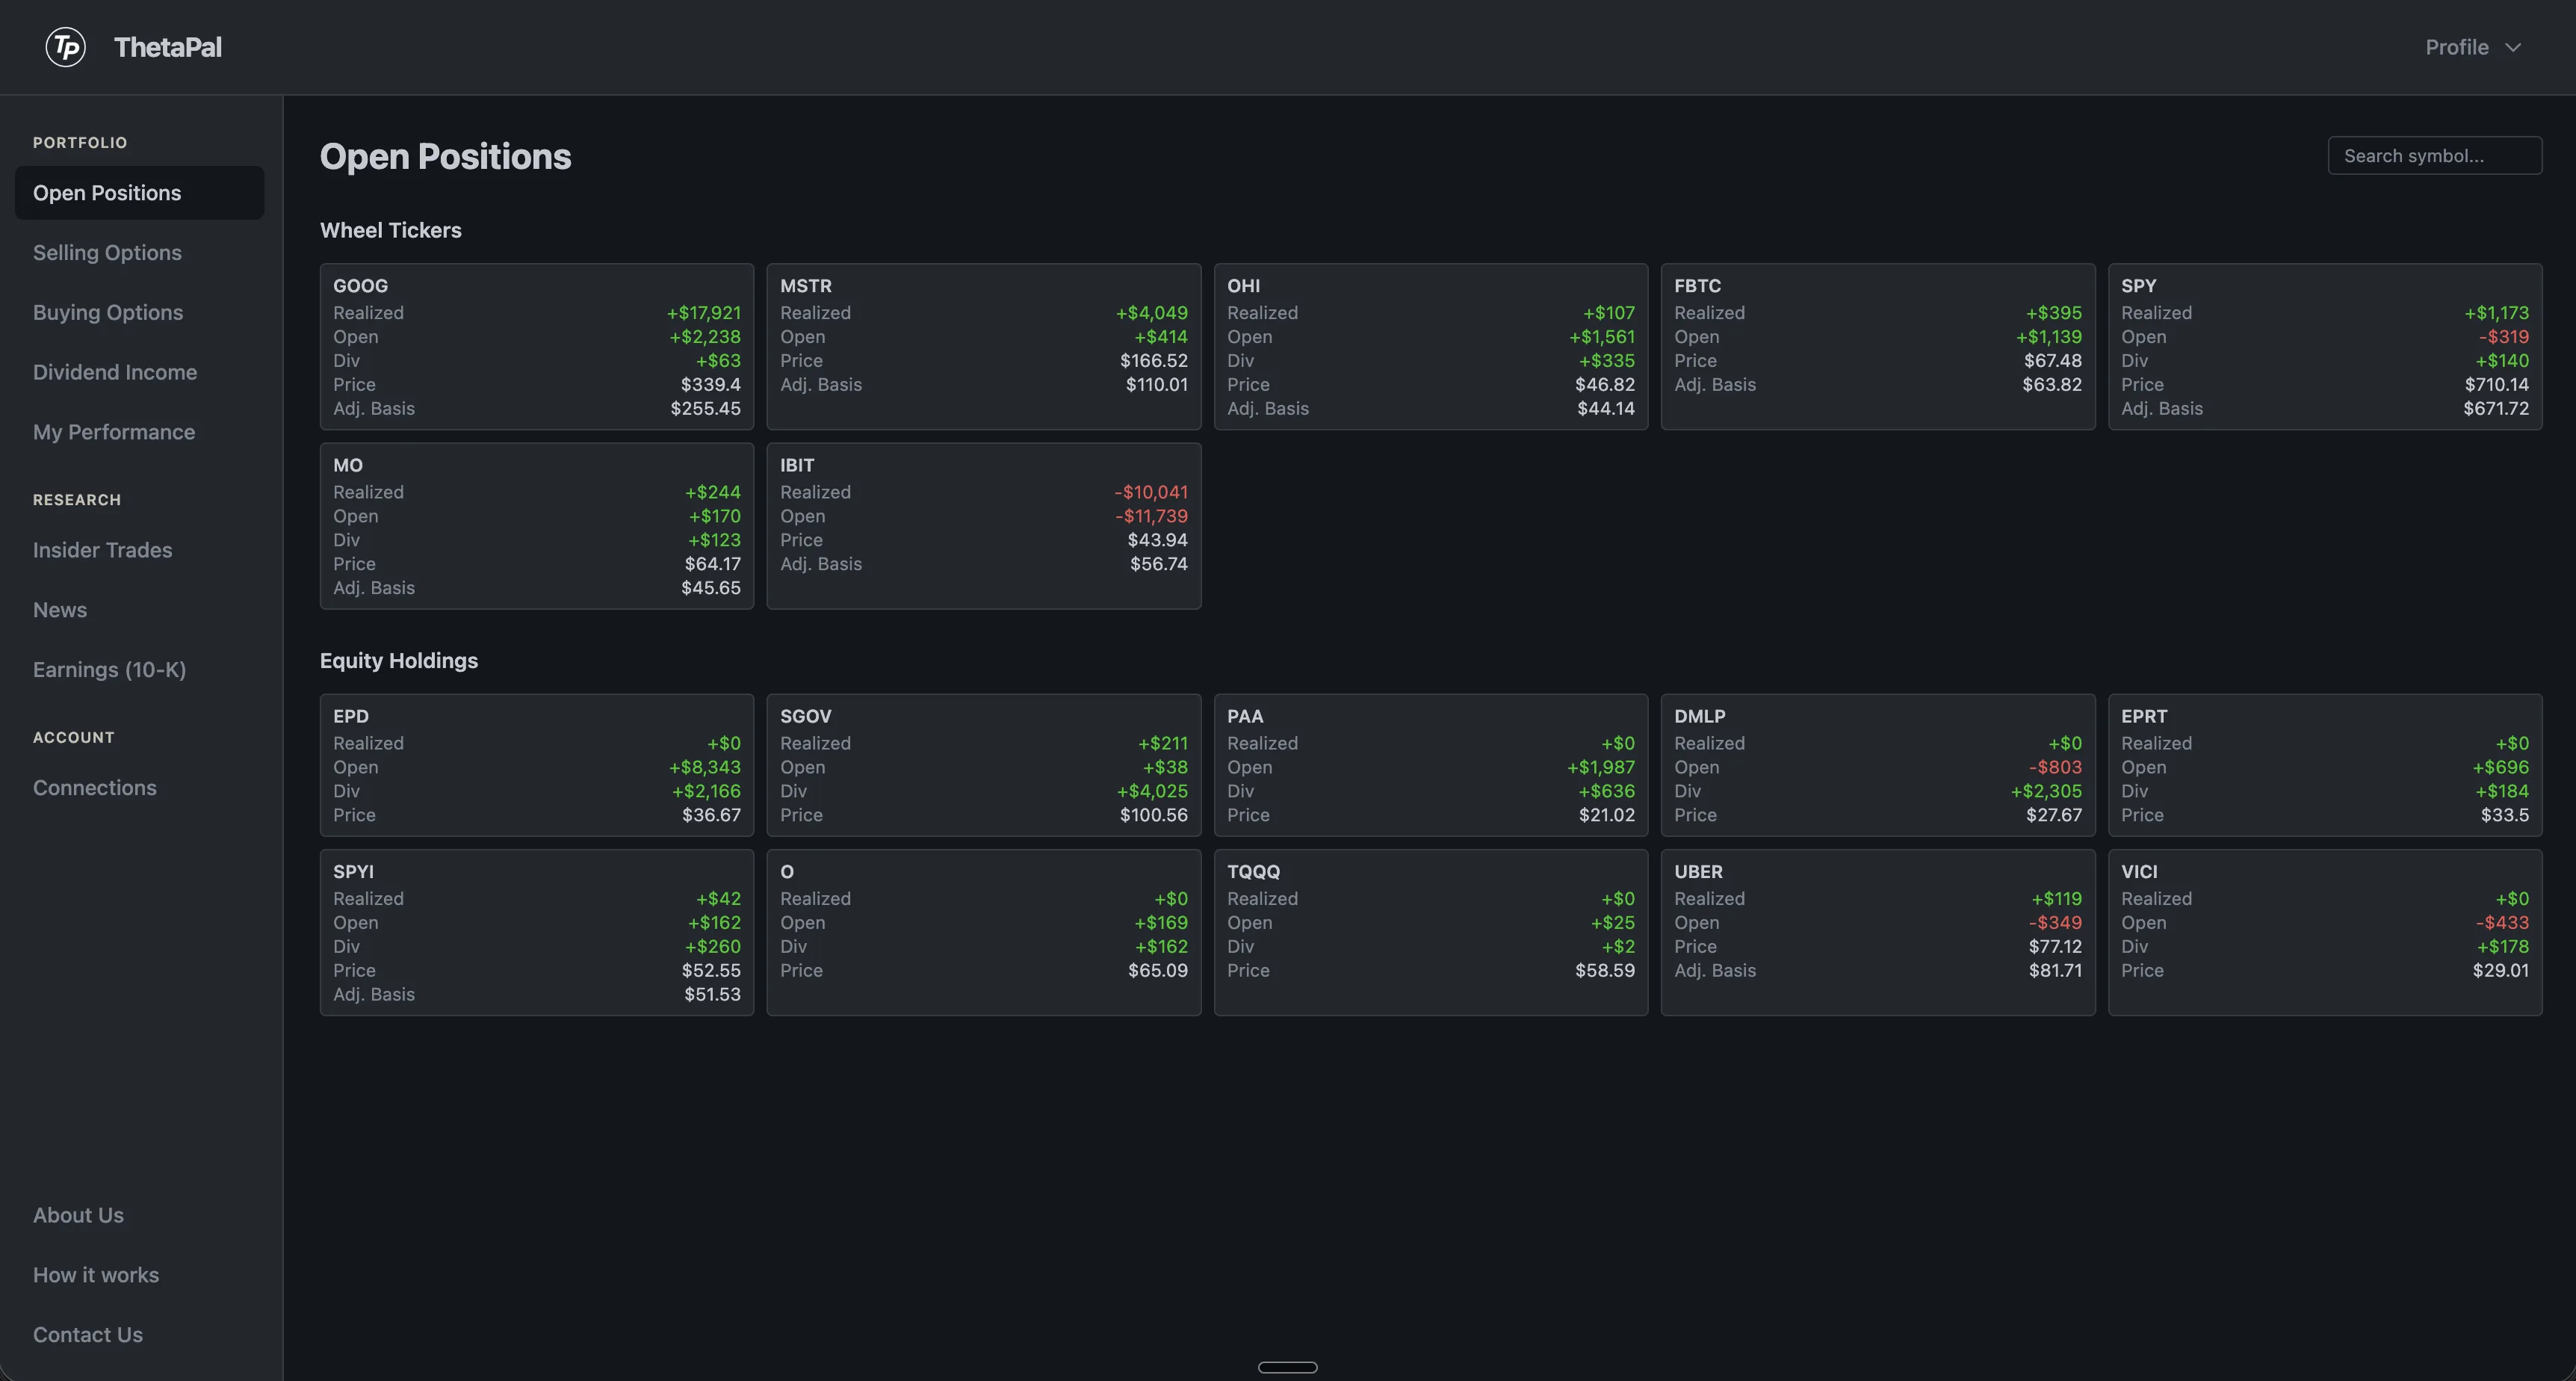
Your portfolio, at a glance
The Open Positions page splits your holdings into two clear sections. Wheel Tickers shows every stock where you're actively running the wheel strategy with options. Equity Holdings shows your buy-and-hold positions.
Each tile shows realized P&L, unrealized gains, dividend income, current price, and adjusted cost basis — everything you need to evaluate a position without clicking into it.
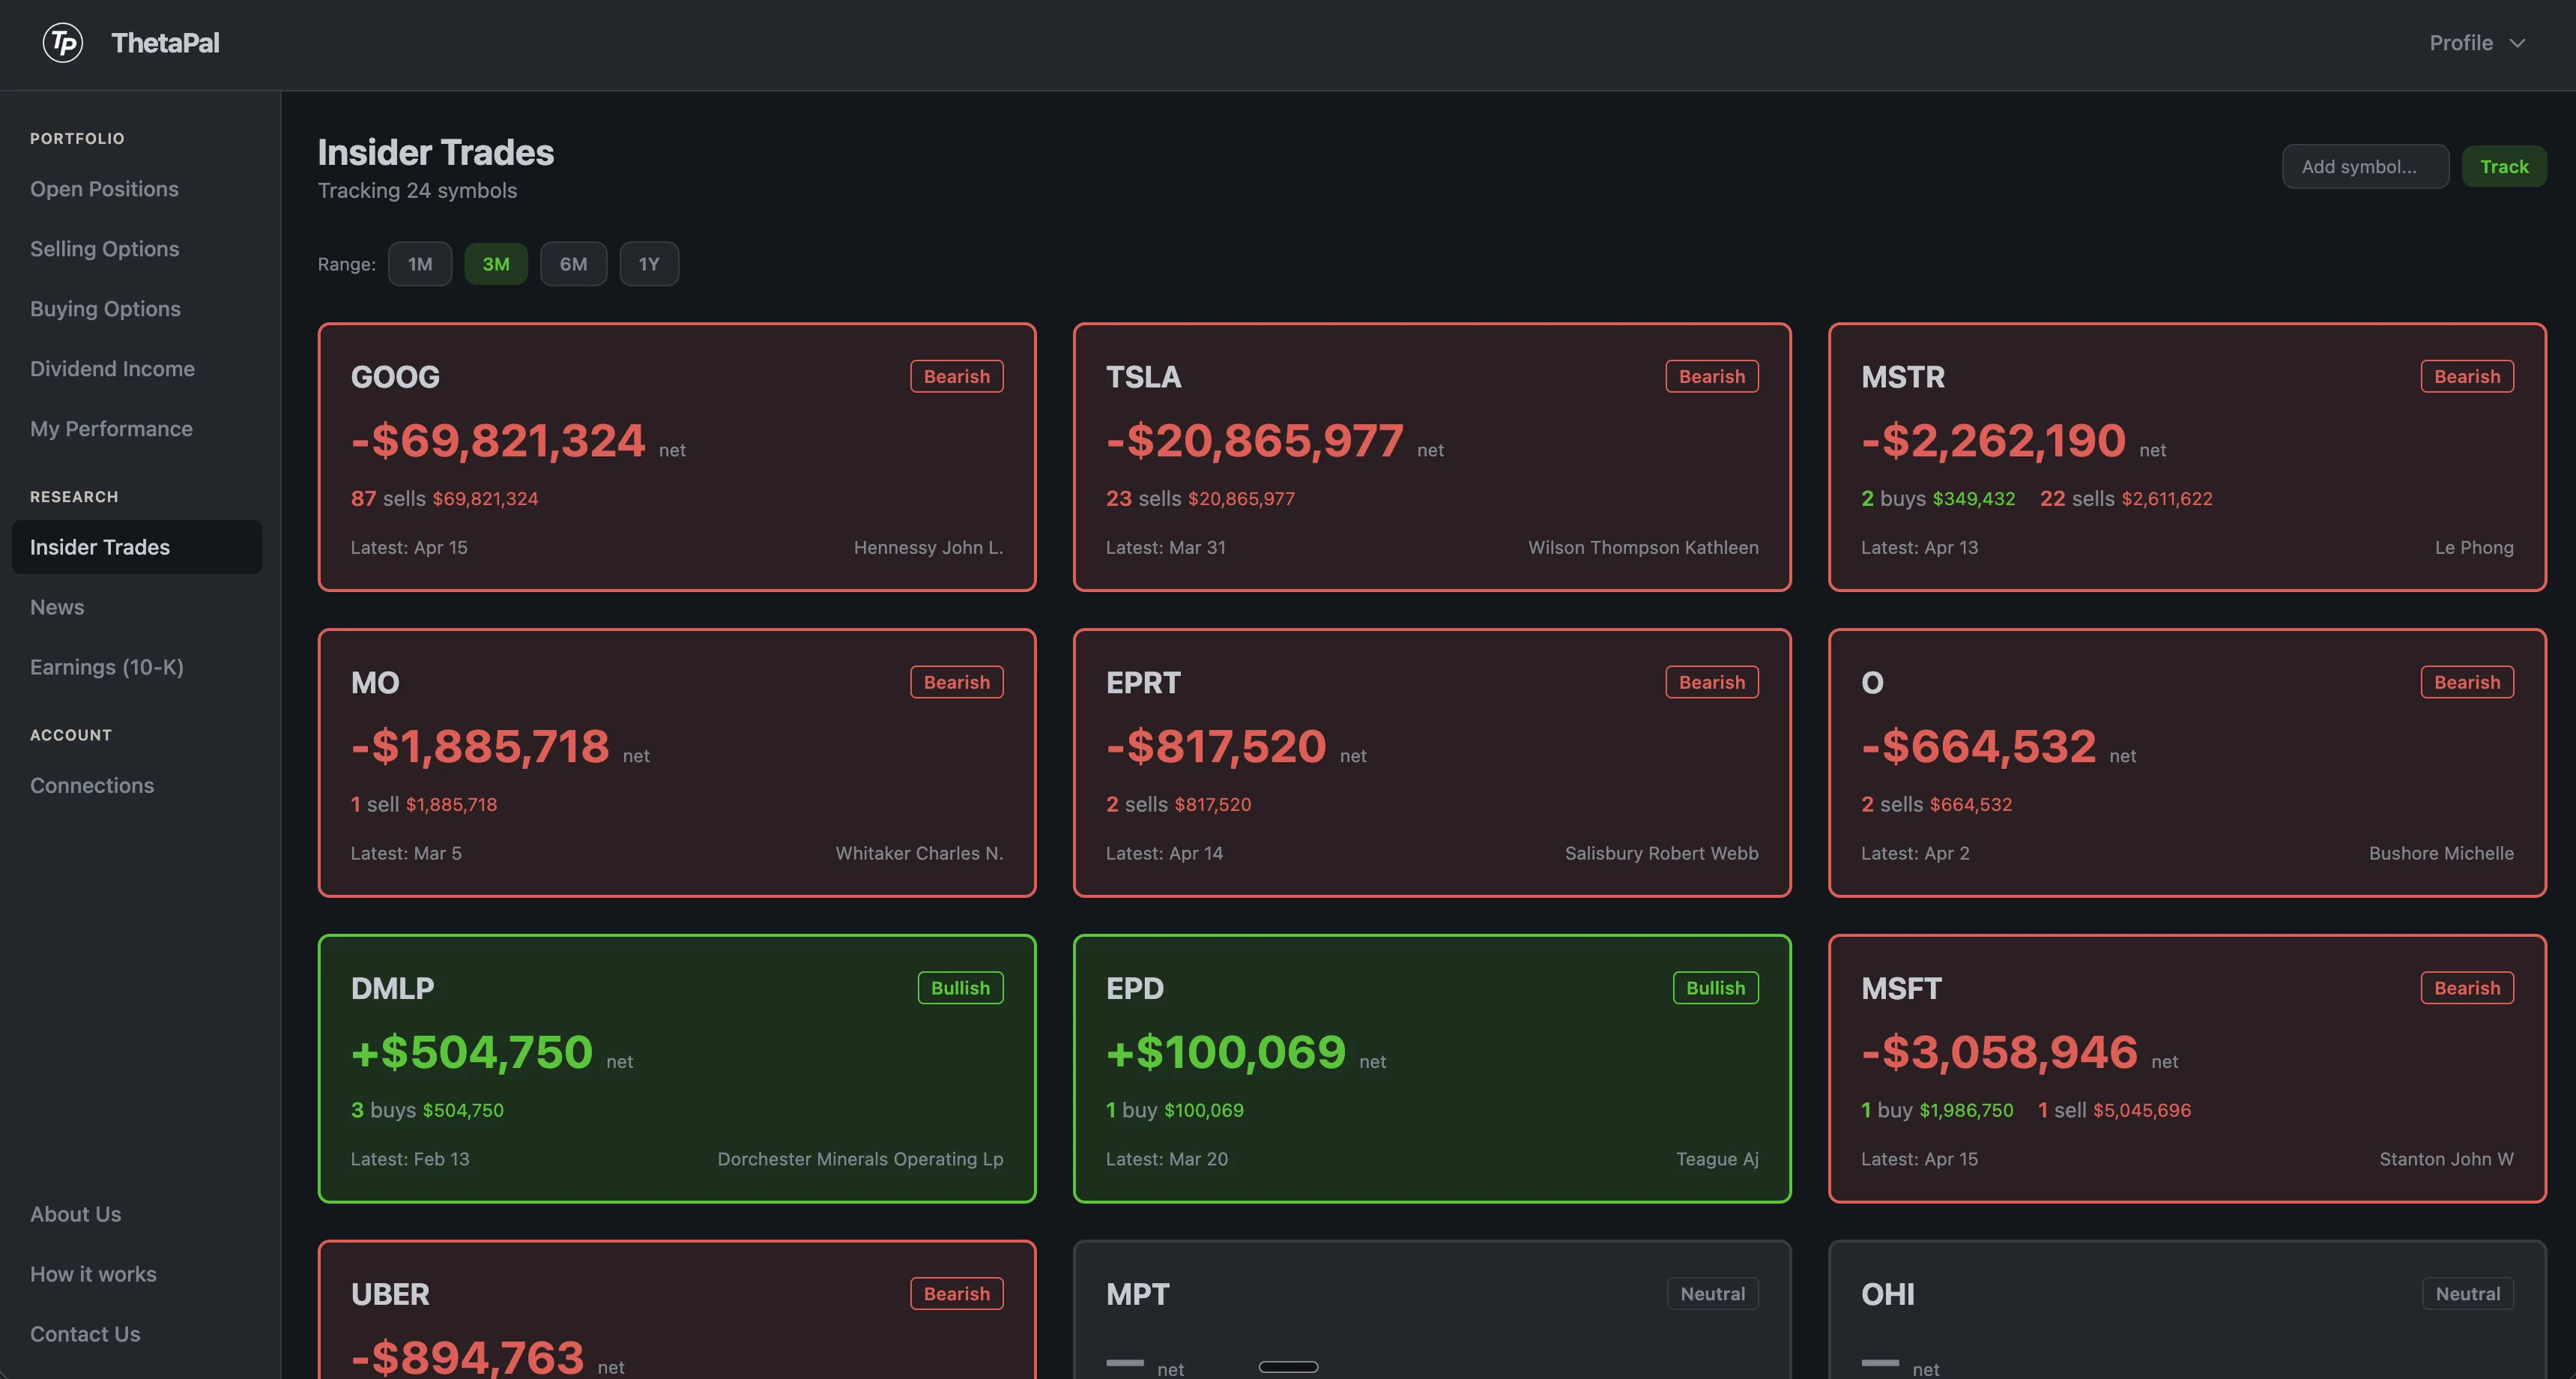
Follow the insiders
See what company executives are doing with their own stock. Every ticker in your portfolio is tracked automatically.
- •Bullish / bearish / neutral signal per ticker
- •Net dollar value of insider buys and sells
- •Insider names and titles
- •Filing dates and transaction history
- •Filterable by 1M, 3M, 6M, or 1Y range
- •Get notified immediately via email
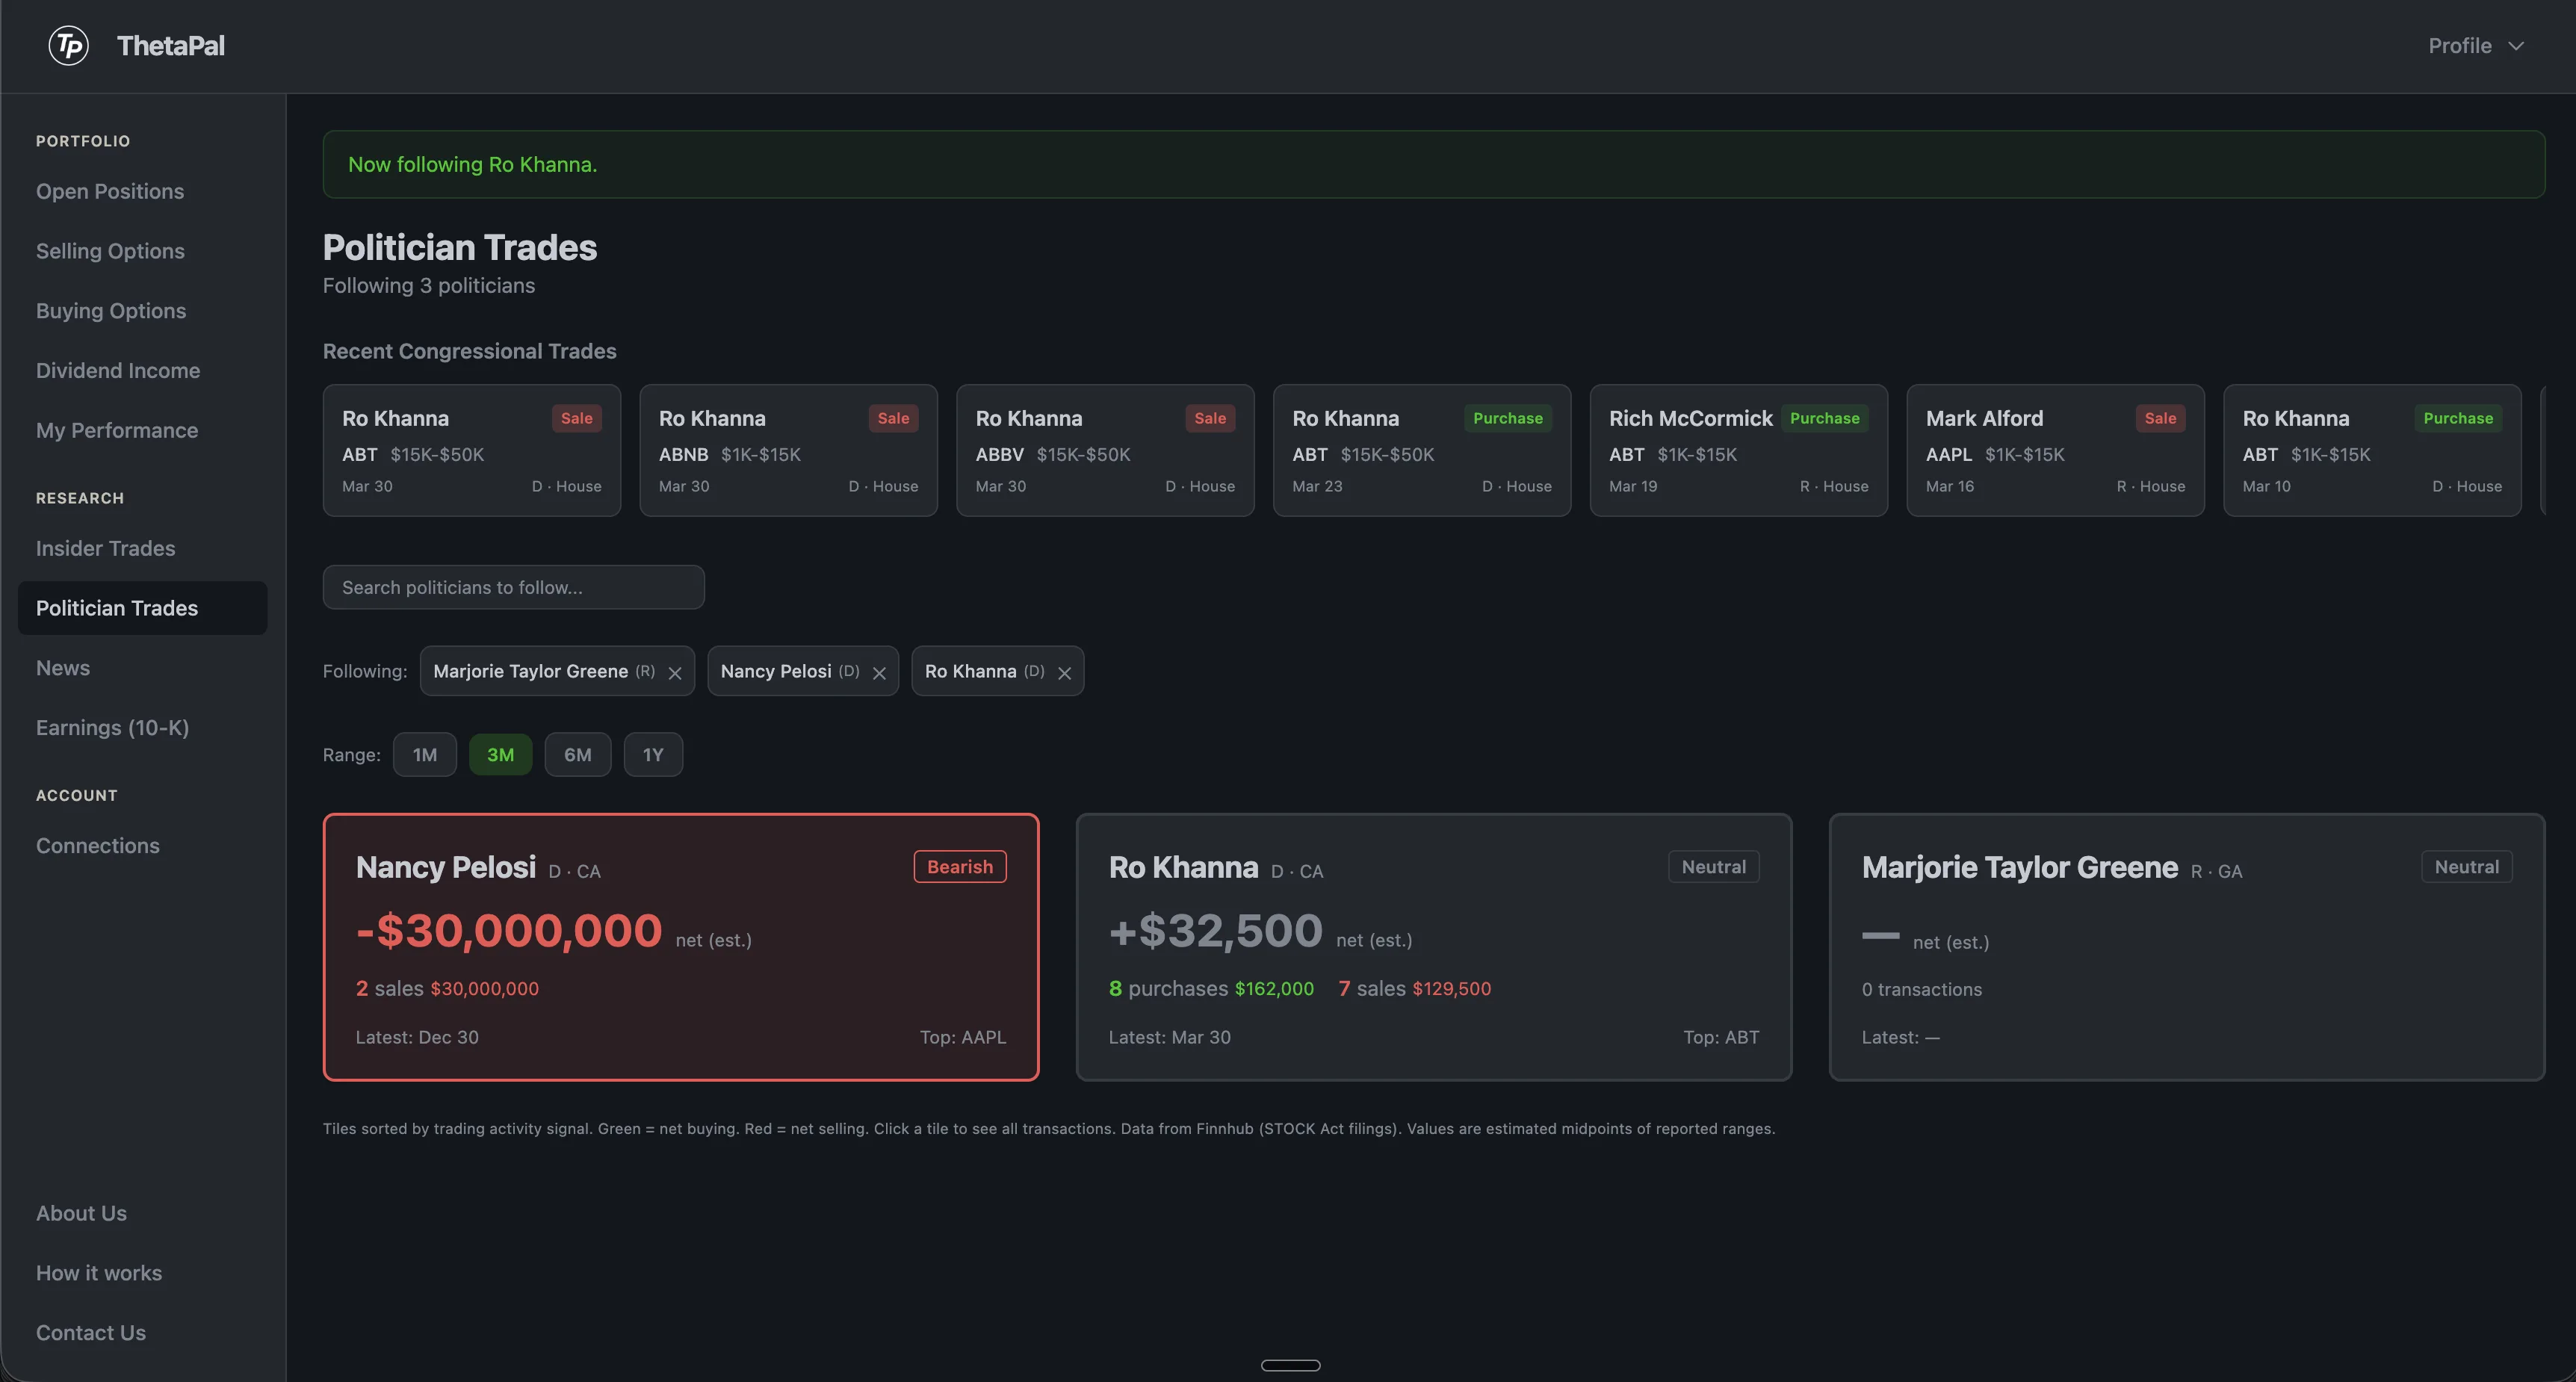
Track what politicians trade
Follow members of Congress and get alerted when they disclose new stock trades. Under the STOCK Act, politicians must report transactions within 45 days. ThetaPal monitors over 1,000 tickers daily to catch every filing.
- •Search and follow any member of Congress
- •Recent congressional trades ticker for discovery
- •Bullish / bearish signals per politician
- •Dollar ranges, symbols, filing dates, and lag
- •Covers both House and Senate
- •Daily email digest for followed politicians
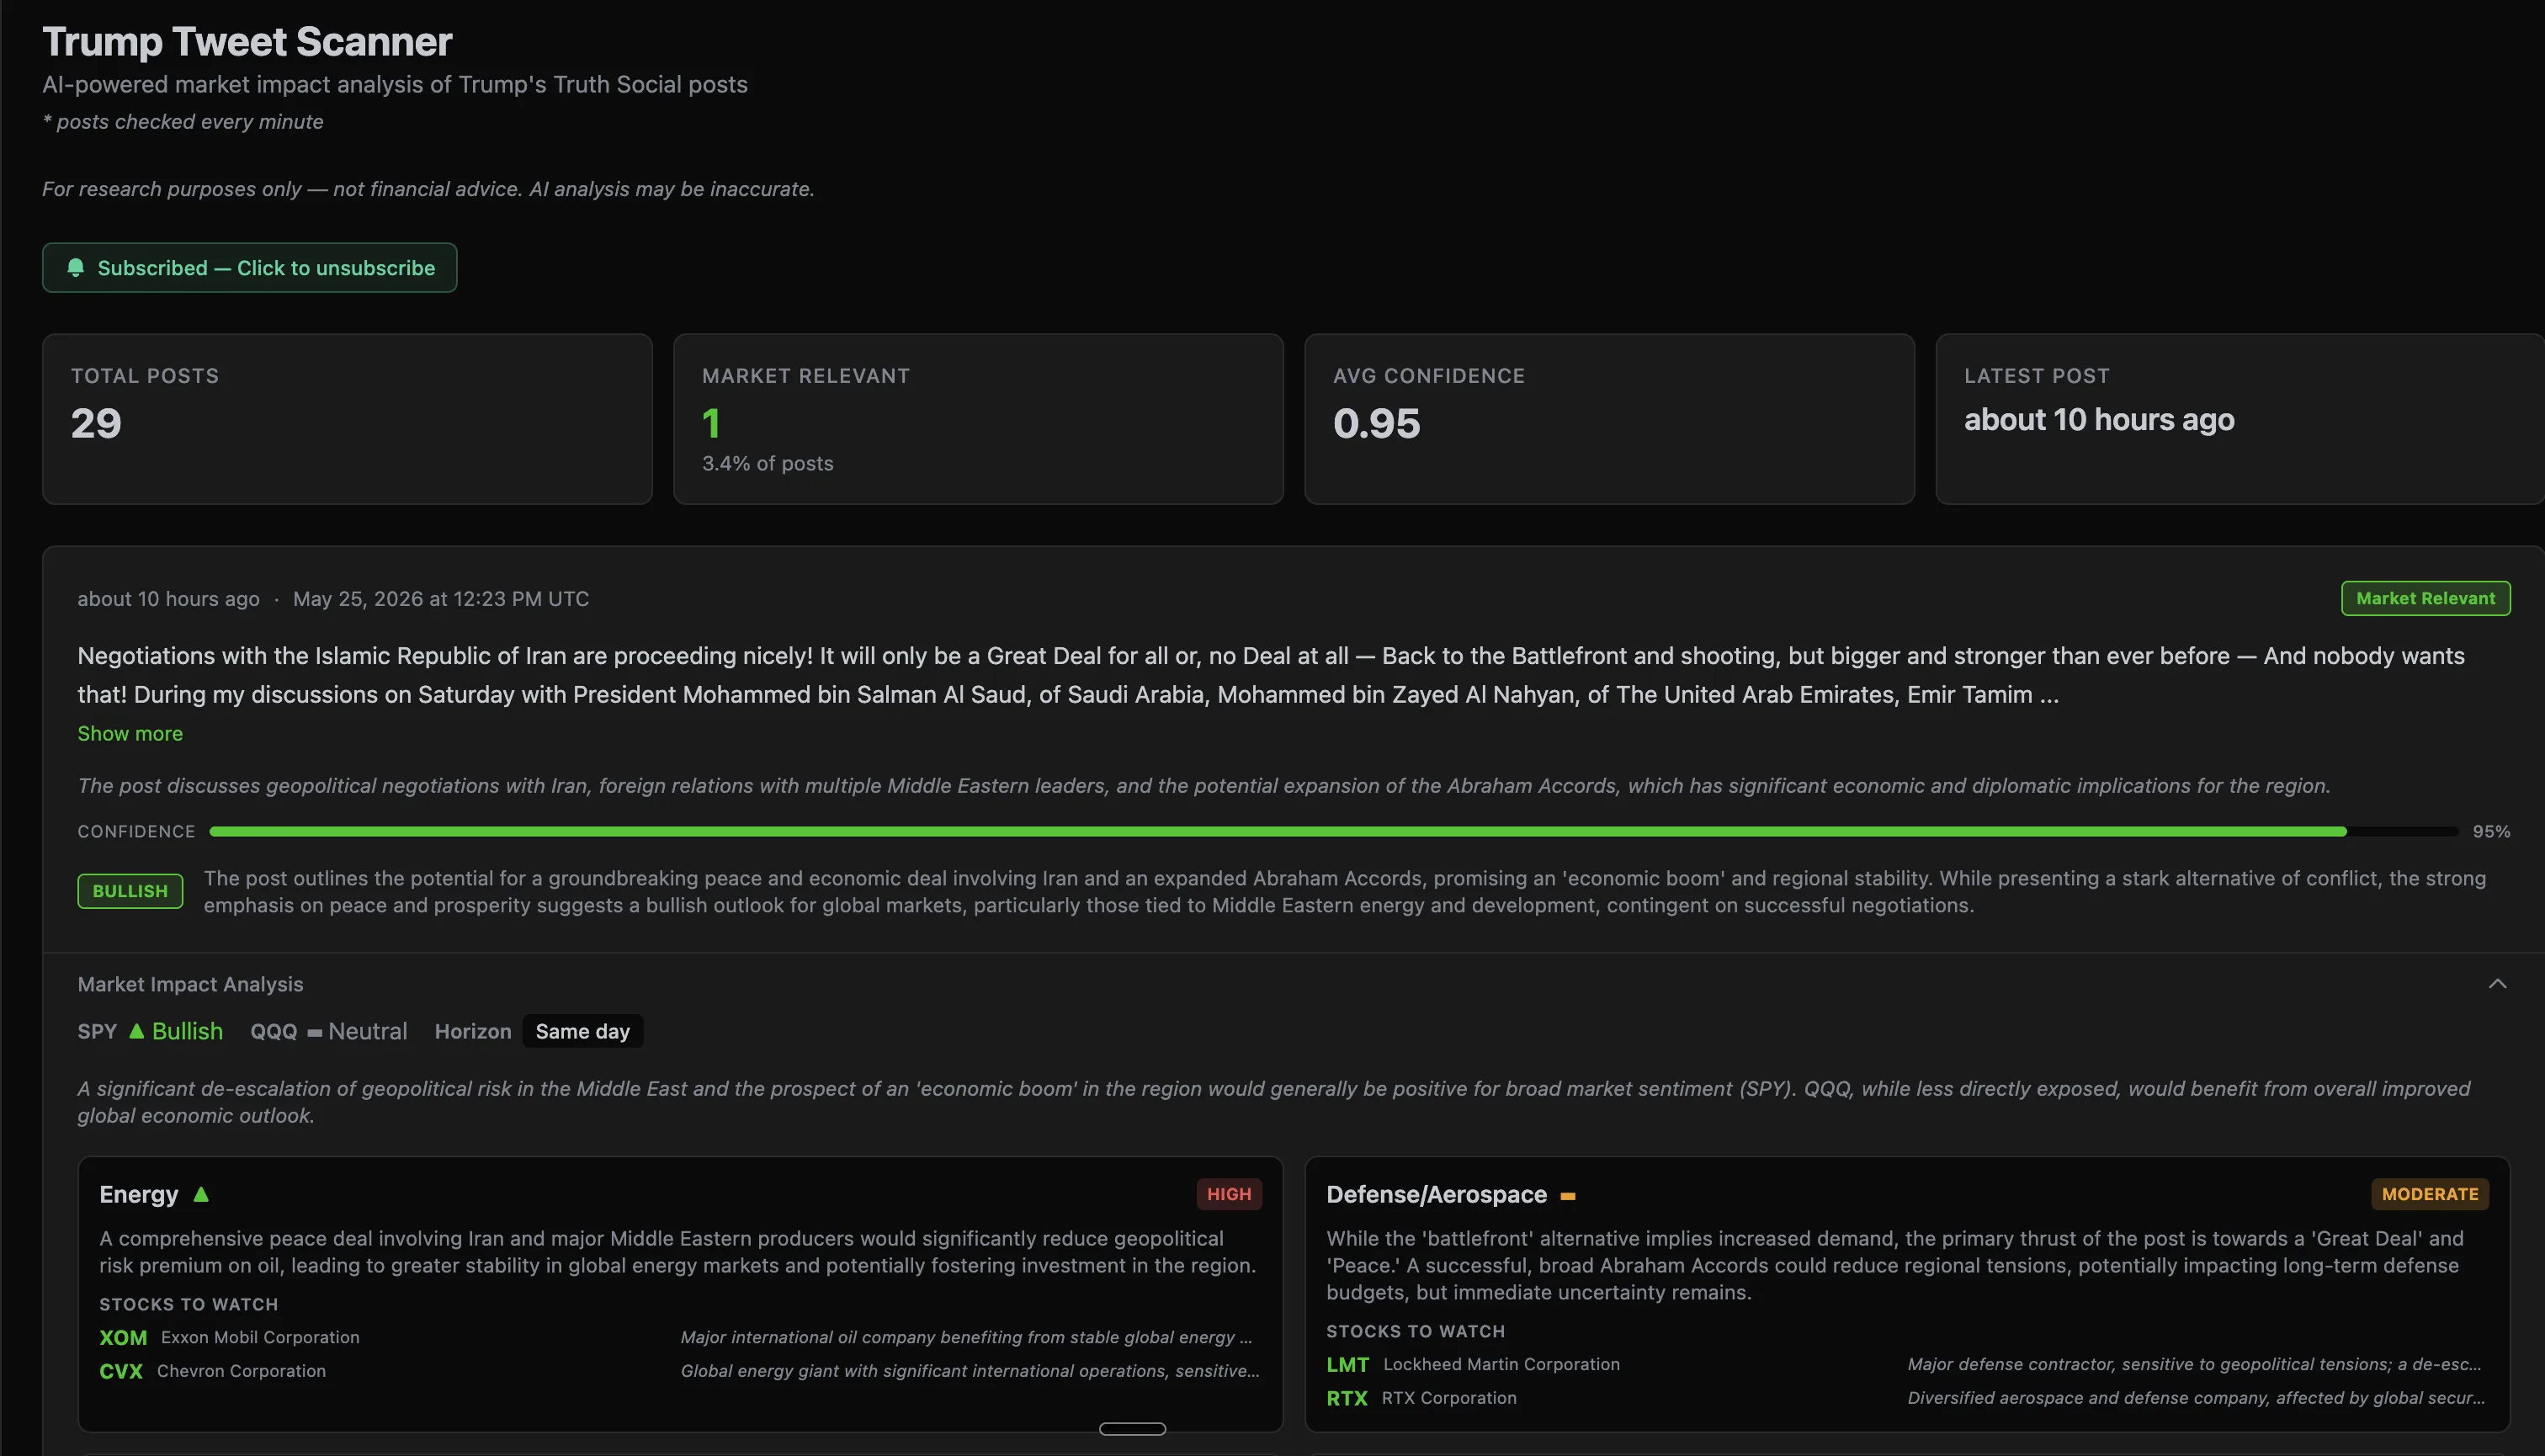
Real-time Trump tweet alerts
Trump's Truth Social posts move markets. ThetaPal scans every post in real time and runs it through a two-phase AI analysis — first screening for market relevance, then generating sector-by-sector impact breakdowns with bullish/bearish signals.
- •Posts checked every minute during market hours
- •AI filters out noise — only market-moving posts flagged
- •Sector impact, sentiment, and stocks to watch
- •Email alerts for high-confidence market signals (Pro+)
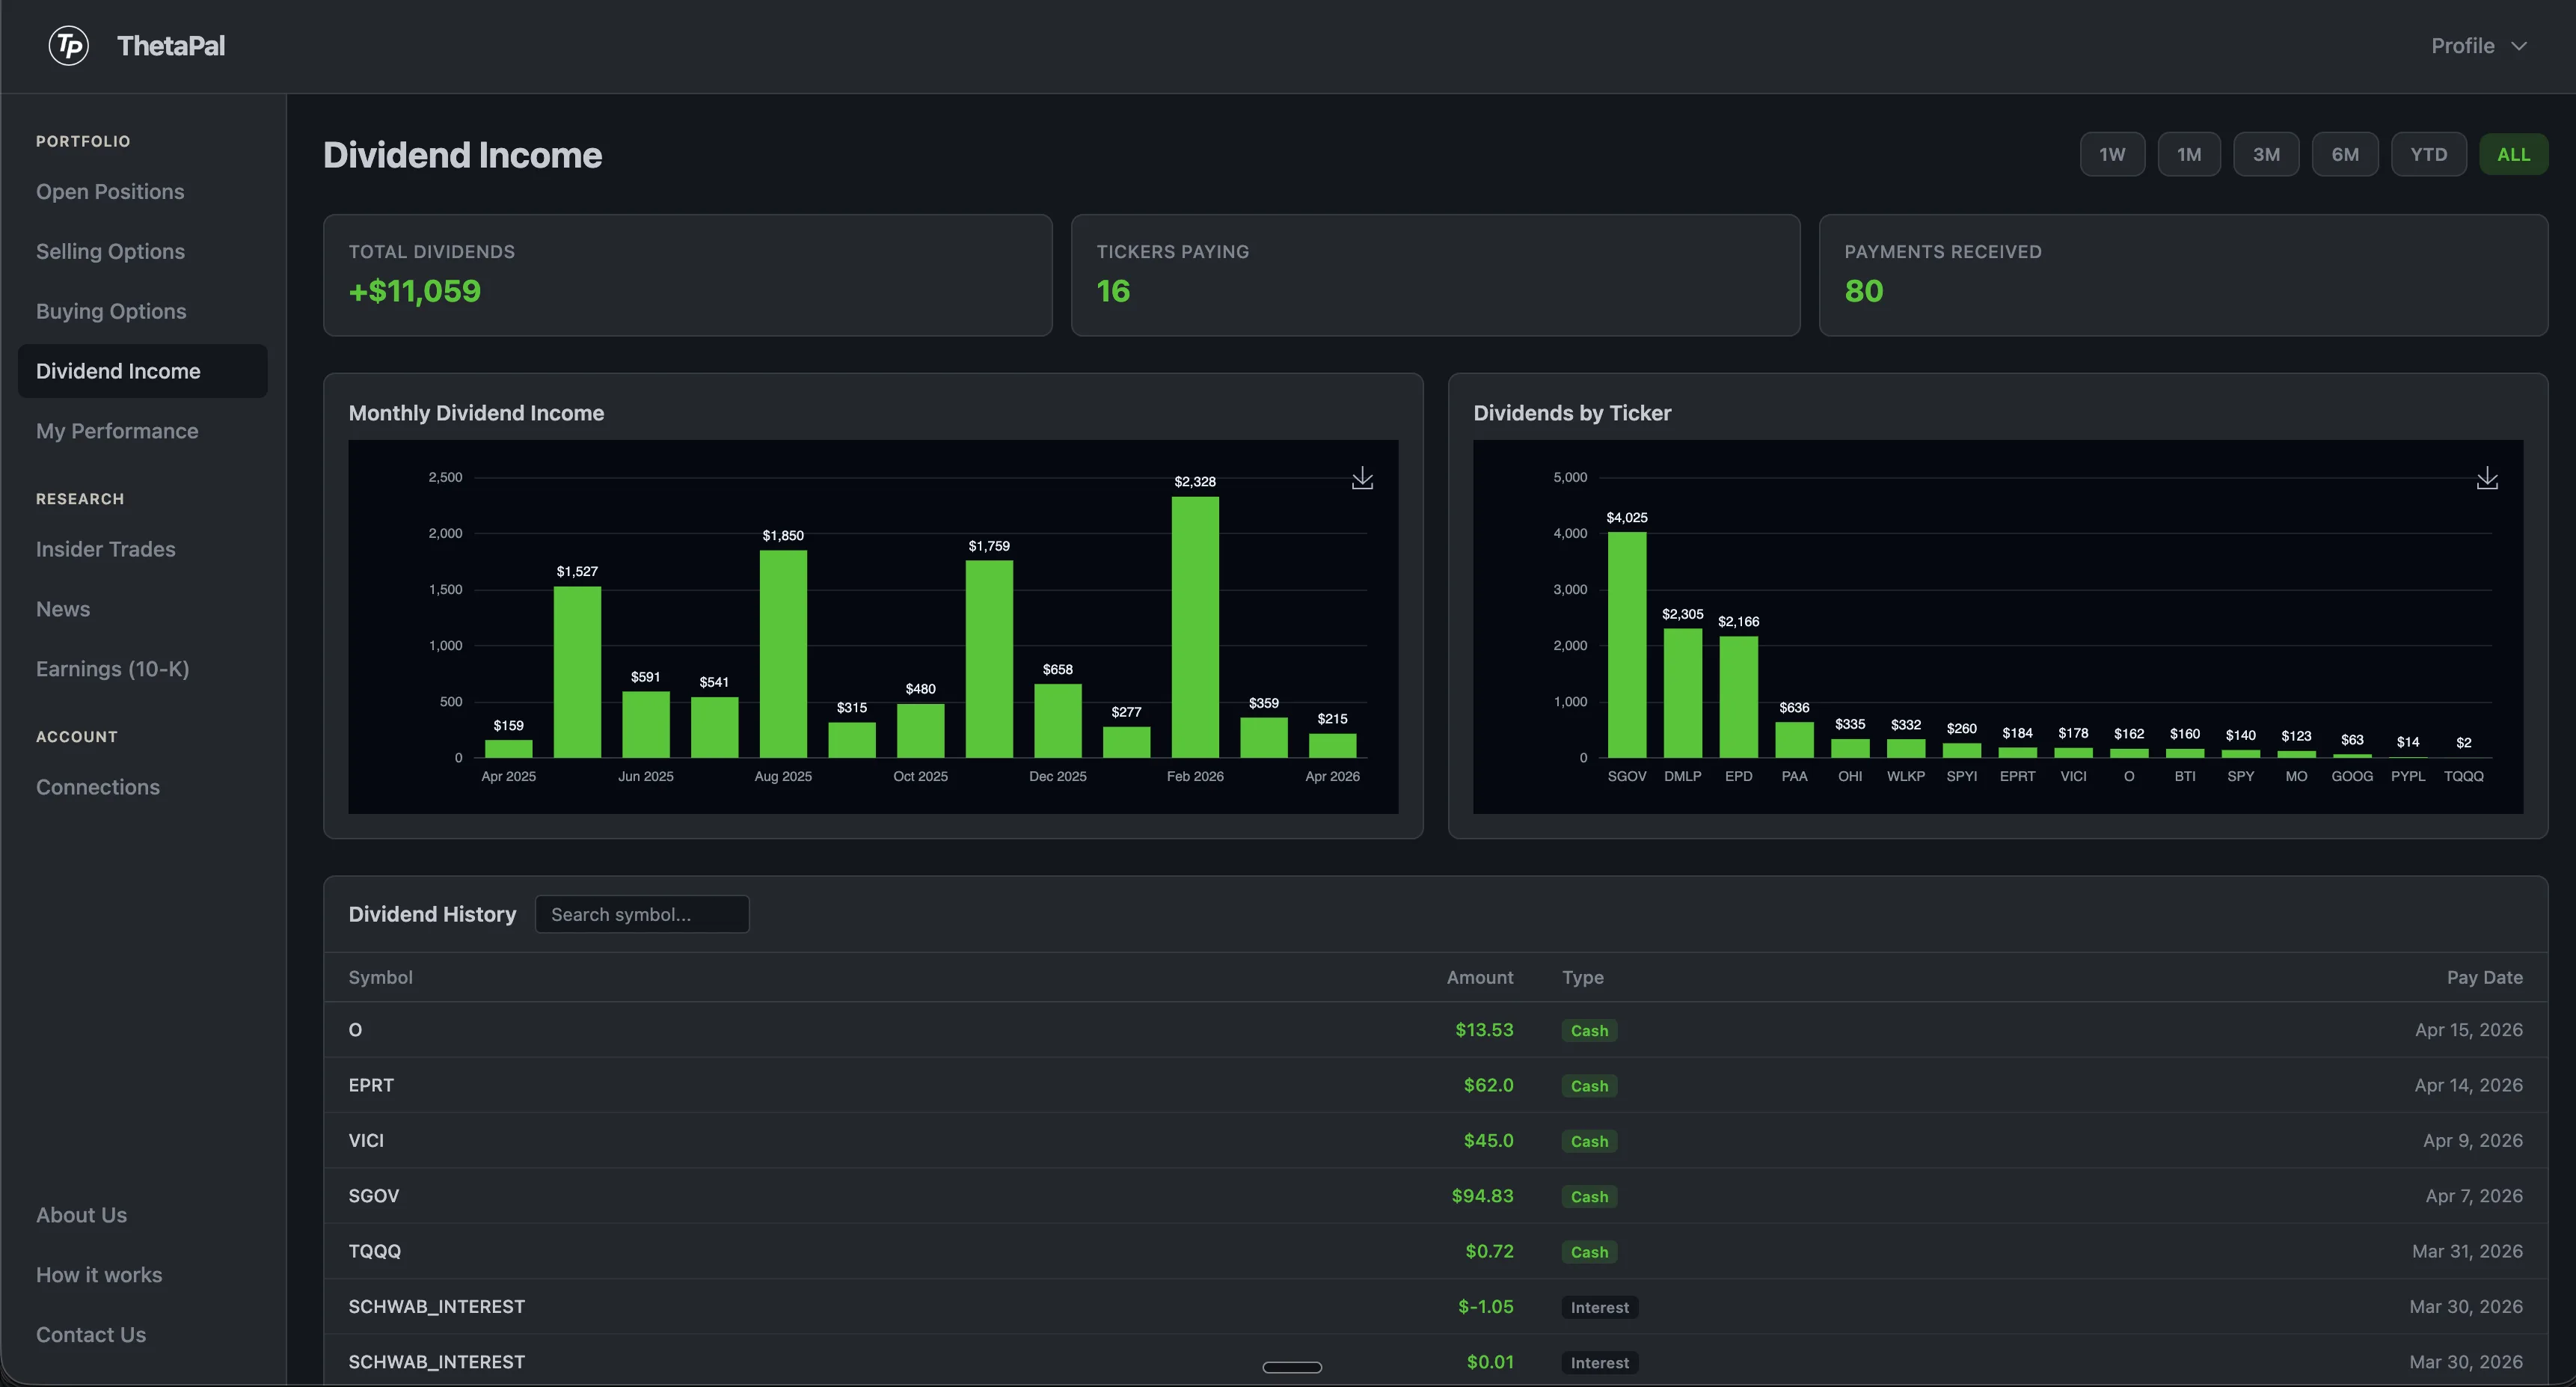
Track every dividend
ThetaPal automatically pulls dividend payments from your brokerage and breaks them down by month and by ticker. See which stocks are paying you the most and how your passive income trends over time.
The full dividend history table lets you search by symbol and see every payment date, amount, and type. Click any chart to expand it for a closer look.
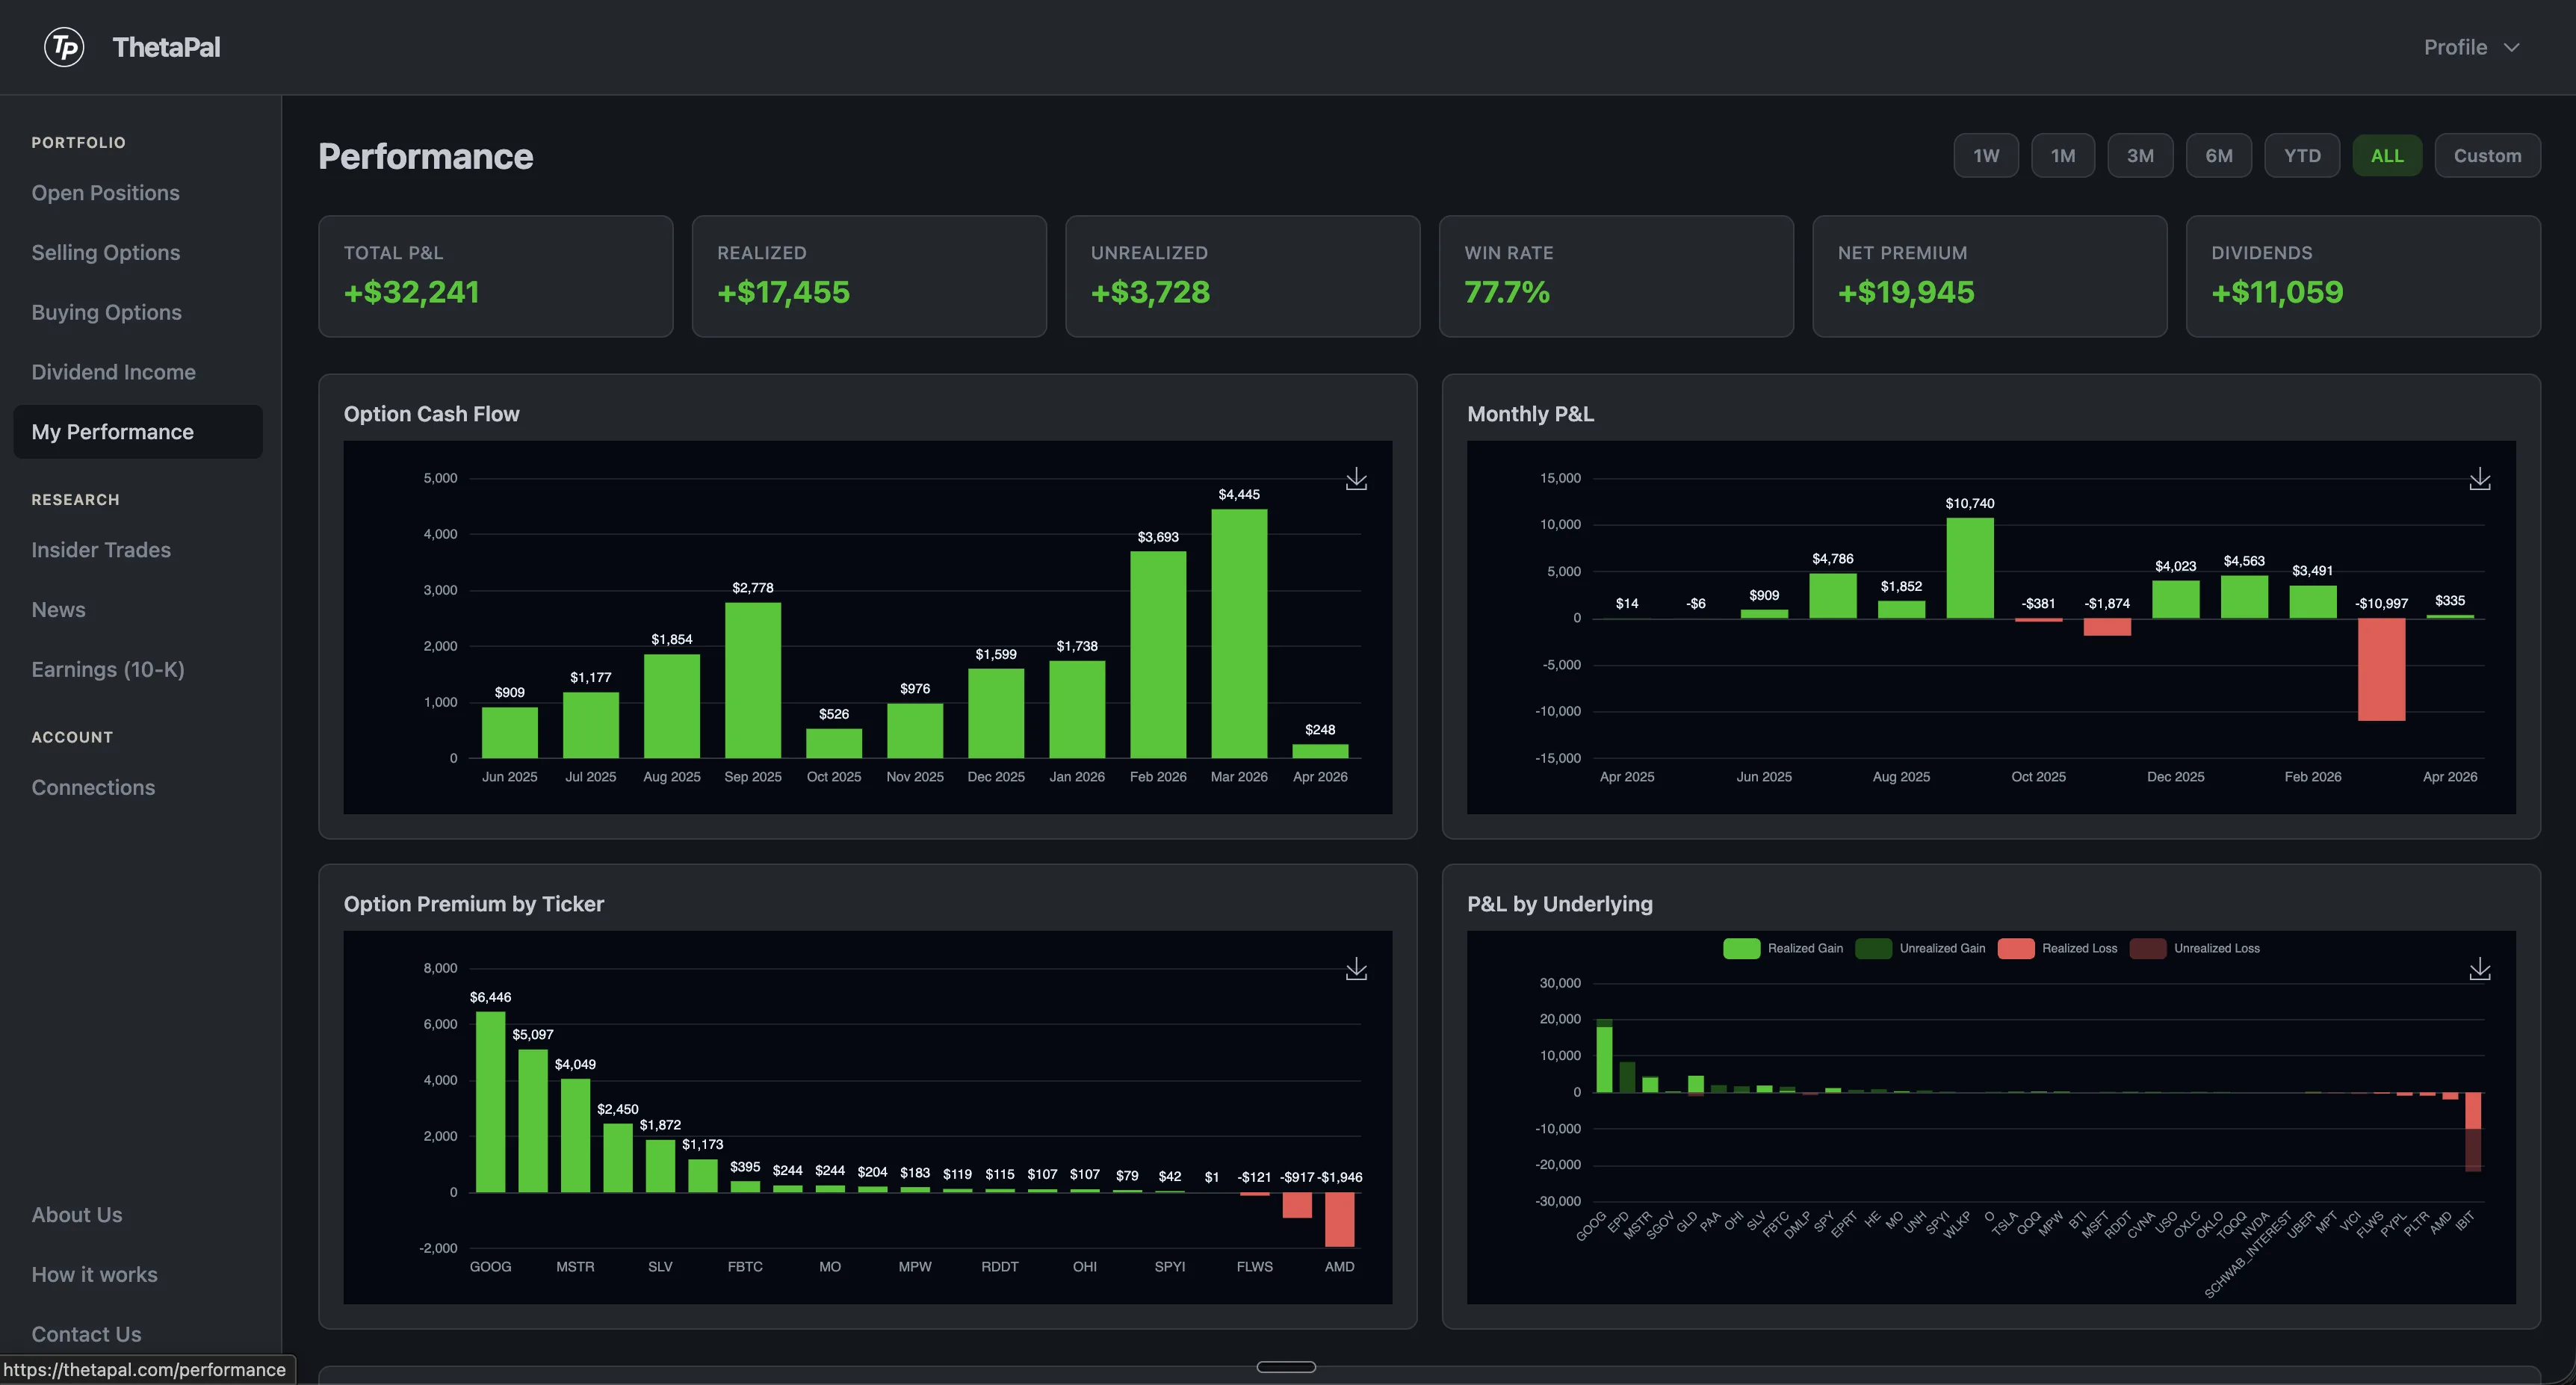
Performance dashboard
Everything you need to measure how your portfolio is doing, filterable by any time range.
- •Total P&L, realized gains, and unrealized positions
- •Win rate across all closed trades
- •Net option premium collected
- •Dividend income earned
- •Monthly cash flow and P&L charts
- •Premium breakdown by ticker
- •Realized vs unrealized by underlying
Click any chart to expand it full-screen.
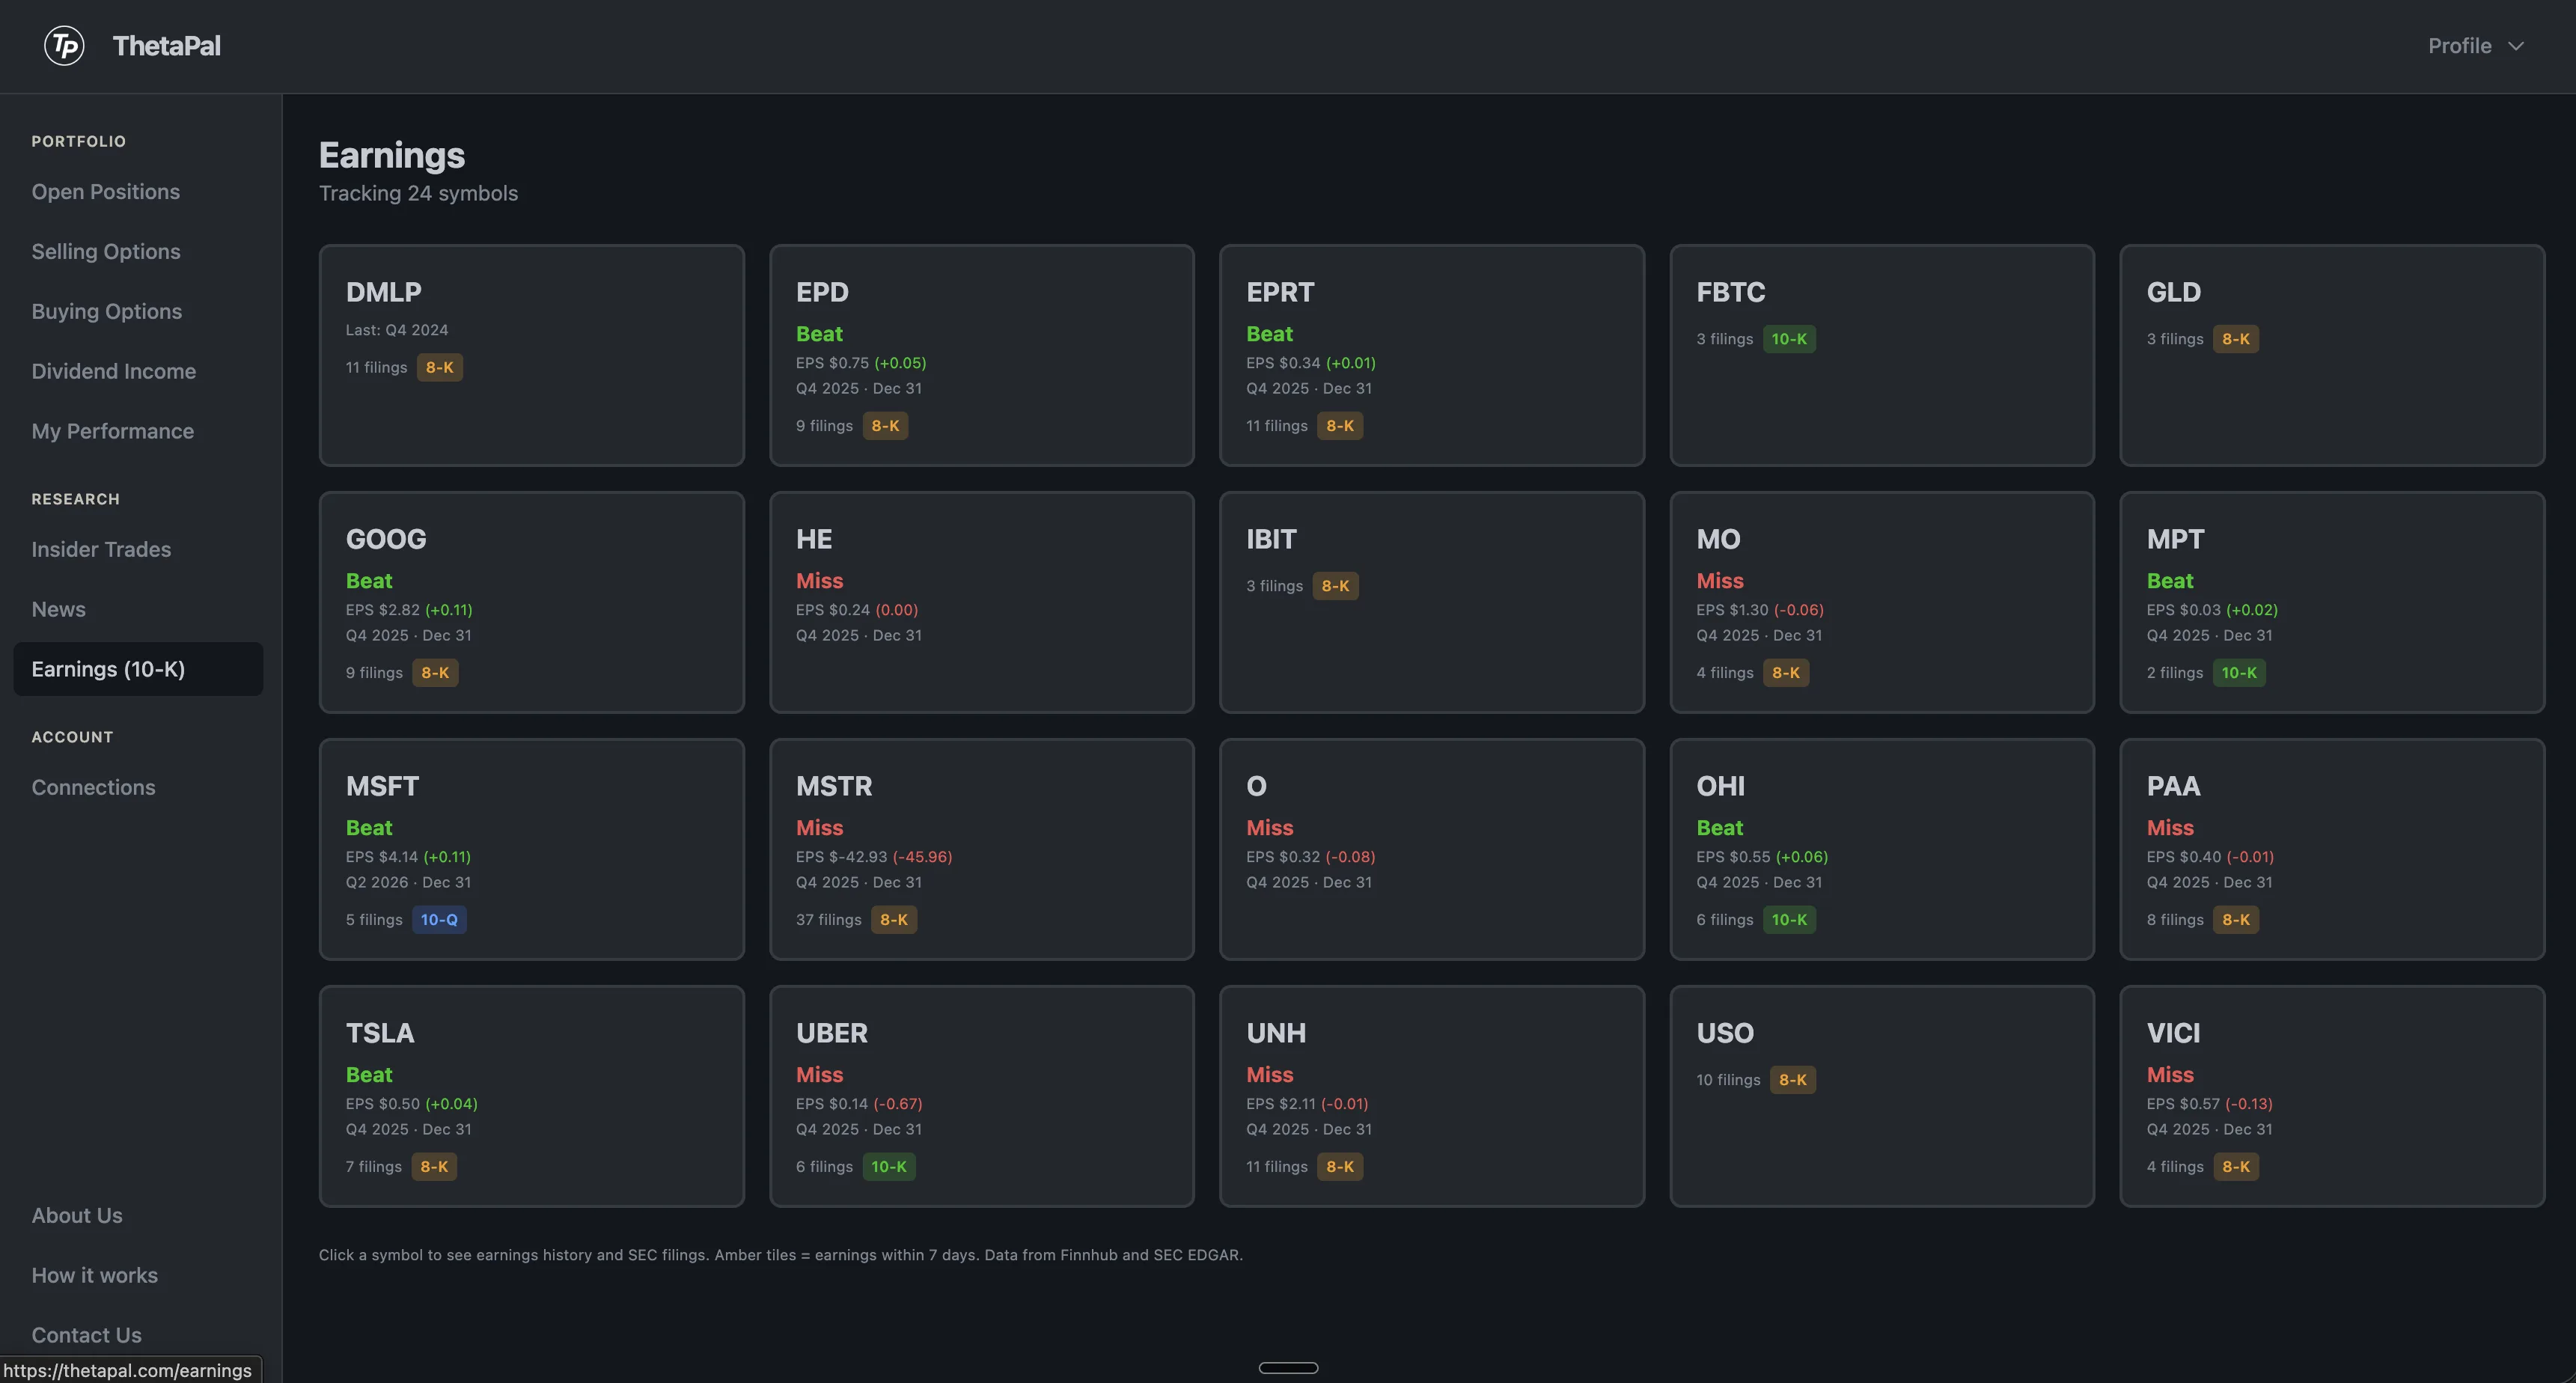
Earnings & SEC filings, AI analysis
Stay on top of fundamentals for every stock you're selling premium on.
- •Earnings beat/miss with color-coded indicators
- •EPS actual vs estimate and surprise percentage
- •Fiscal quarter and report date
- •10-K, 10-Q, and 8-K filings from SEC EDGAR
- •Direct links to original SEC documents
- •AI-powered analysis on every 10-K and 10-Q
AI reads the filings so you don't have to
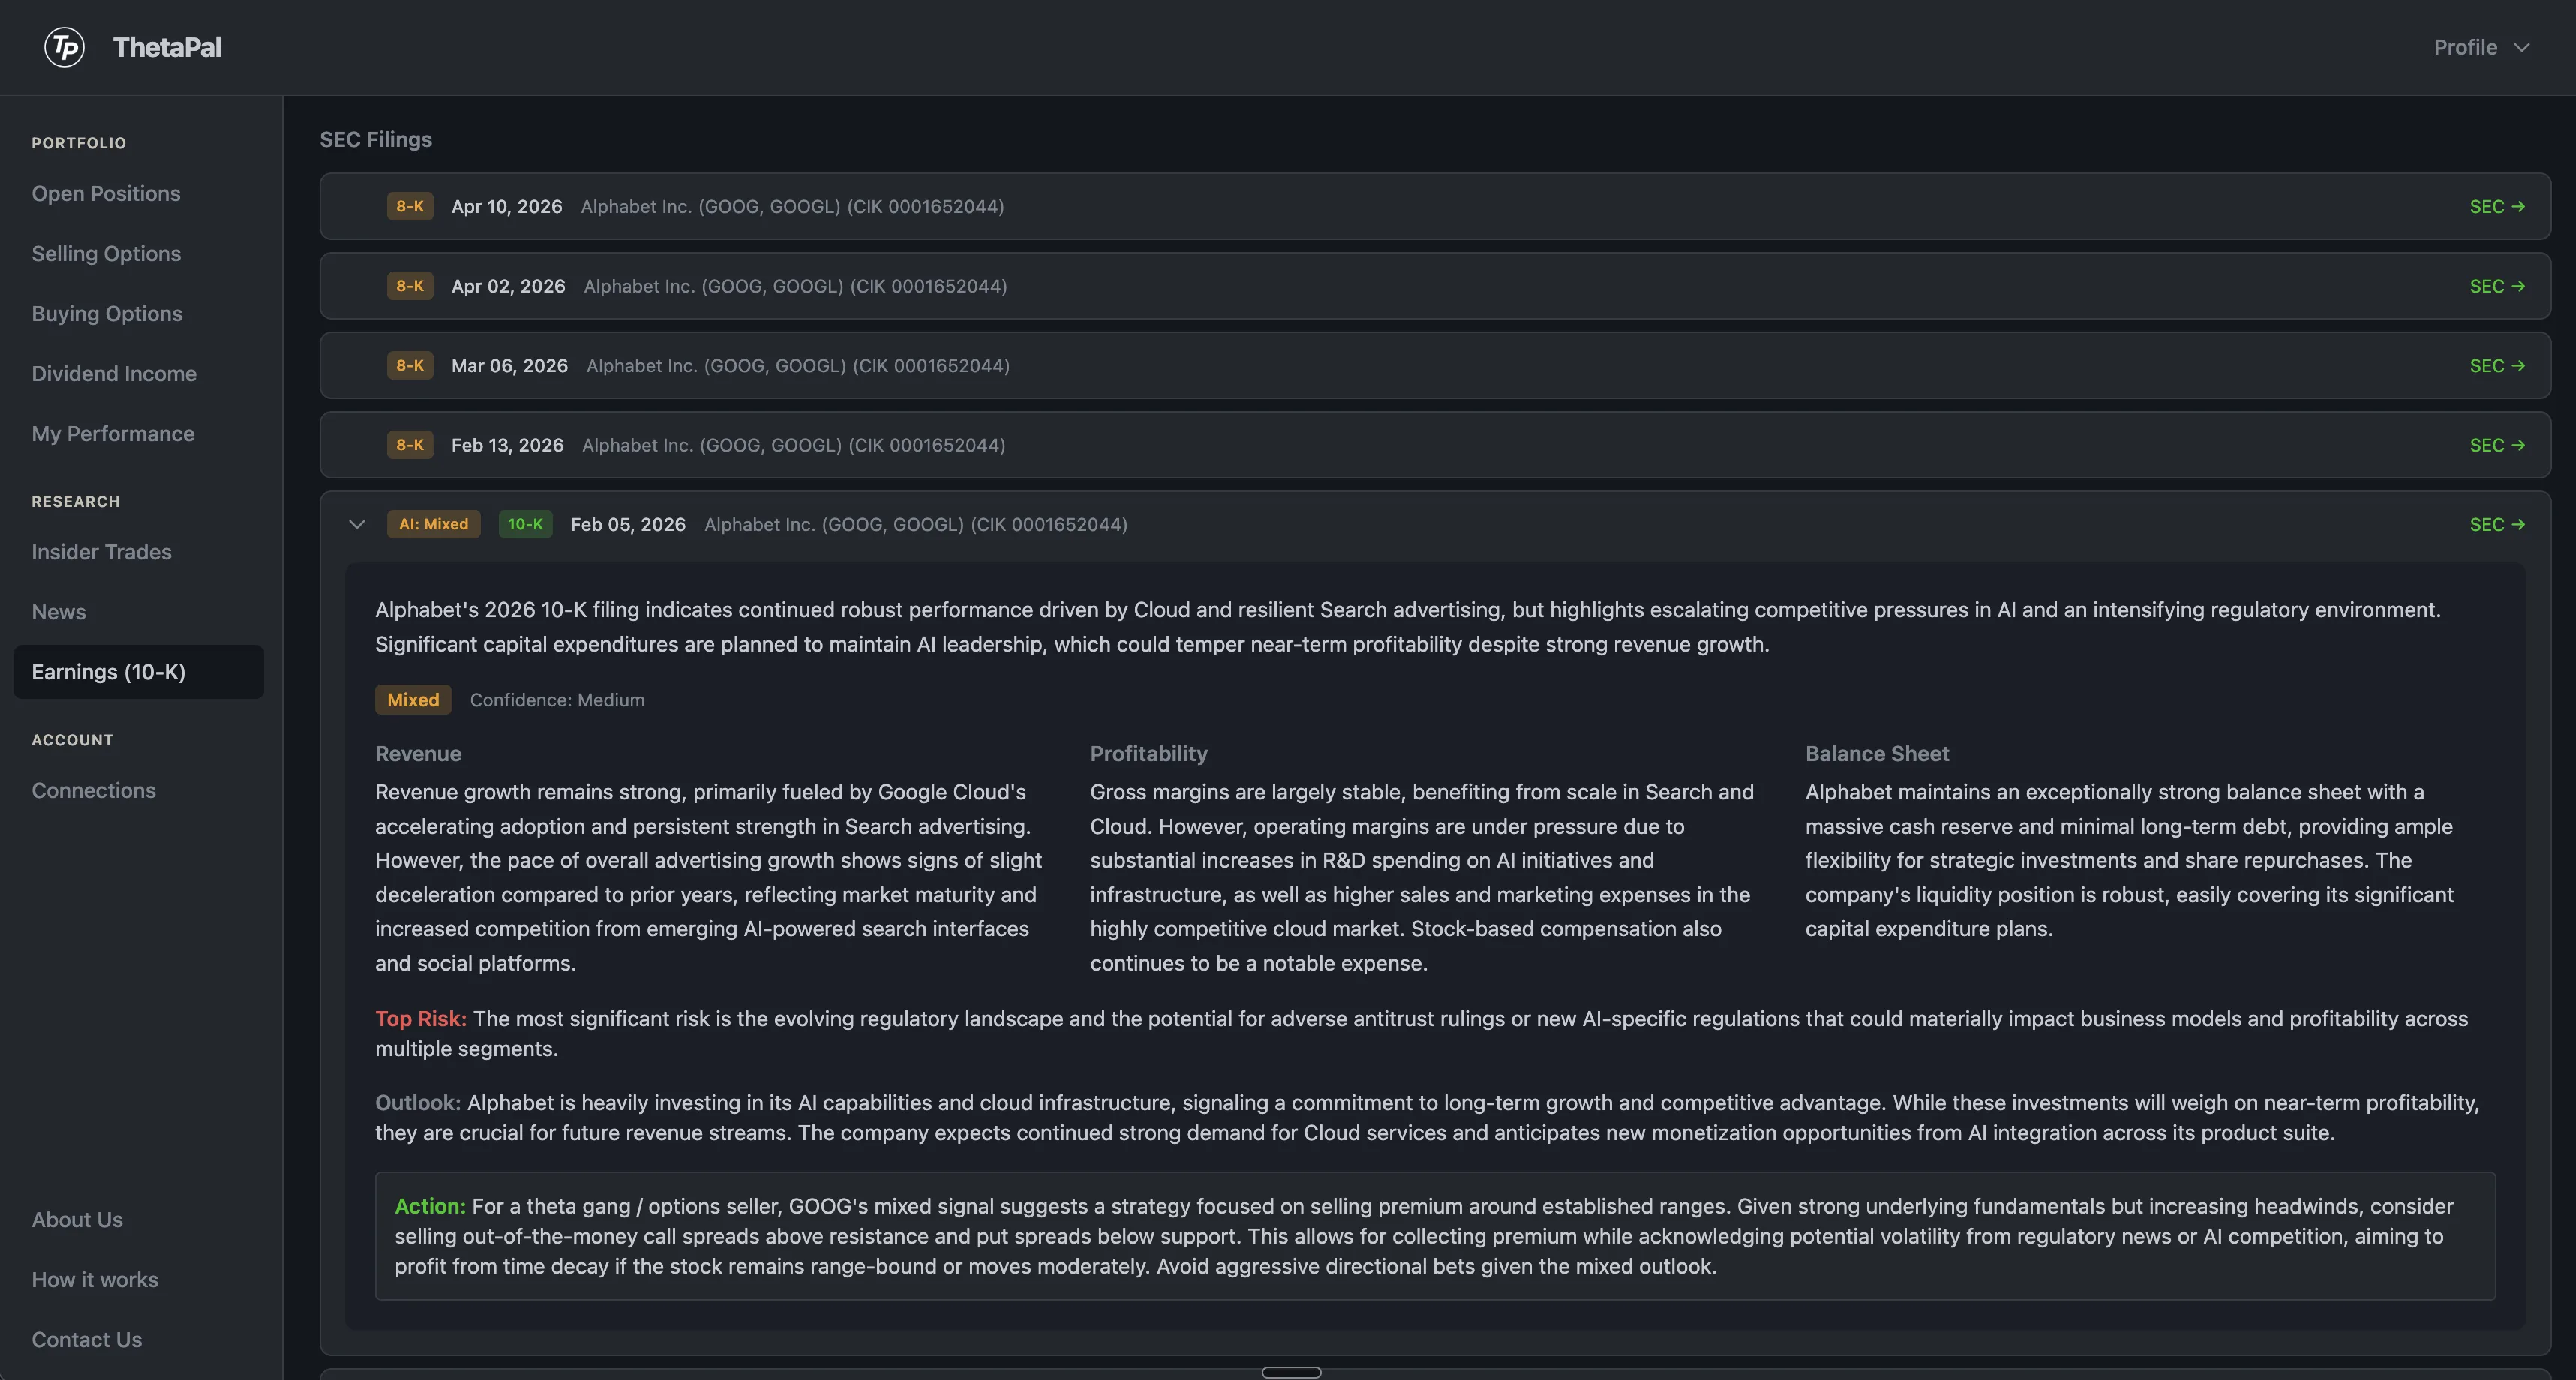
Deep-dive analysis on every 10-K and 10-Q
Each annual and quarterly filing is automatically analyzed by AI. The accordion expands to reveal a full breakdown — revenue trends, profitability, balance sheet health, top risks, red flags, and a concrete action recommendation tailored for options sellers. Signal badges (bullish, bearish, mixed) let you scan at a glance.
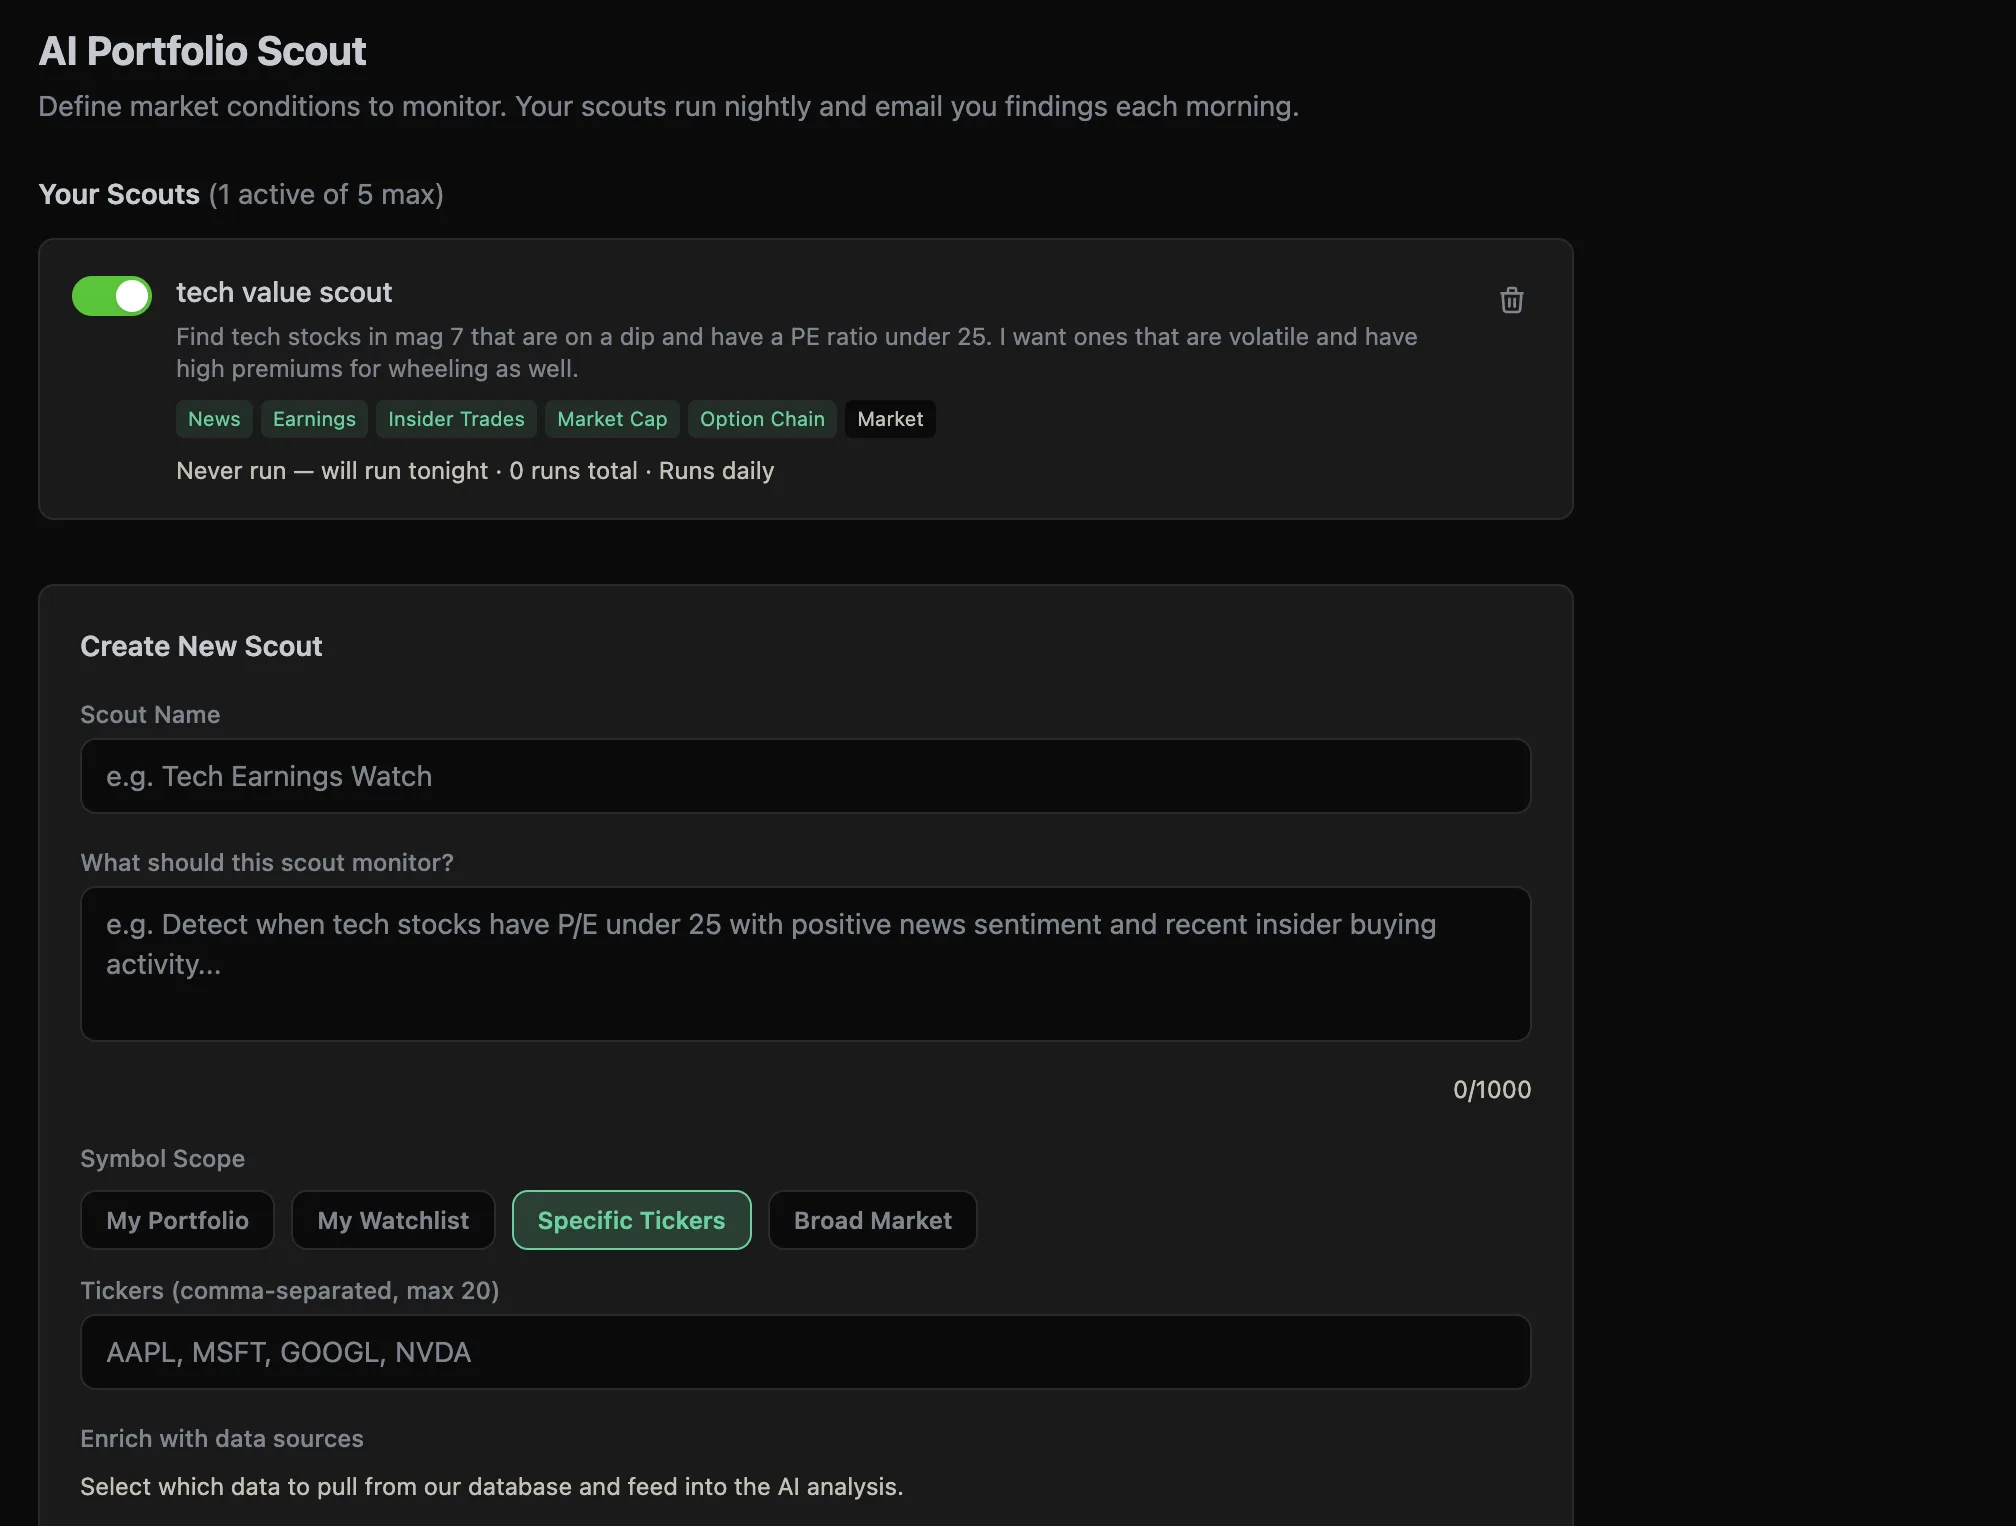
AI Portfolio Scout NEW
Describe what market conditions you want to monitor in plain English. Your AI scouts run every night after market close, analyze real data from our database, and email you a digest of actionable findings before the bell.
- •Natural language criteria — no complex rule builders
- •10 data source pills: News, P/E, Earnings, Volume, Insider Trades, and more
- •Monitor your portfolio, watchlist, specific tickers, or the broad market
- •Findings include bullish/bearish signals and urgency levels
- •One morning email digest — no spam, 7-day smart cooldown
- •Up to 5 active scouts on Premium
Your scouts deliver findings like this
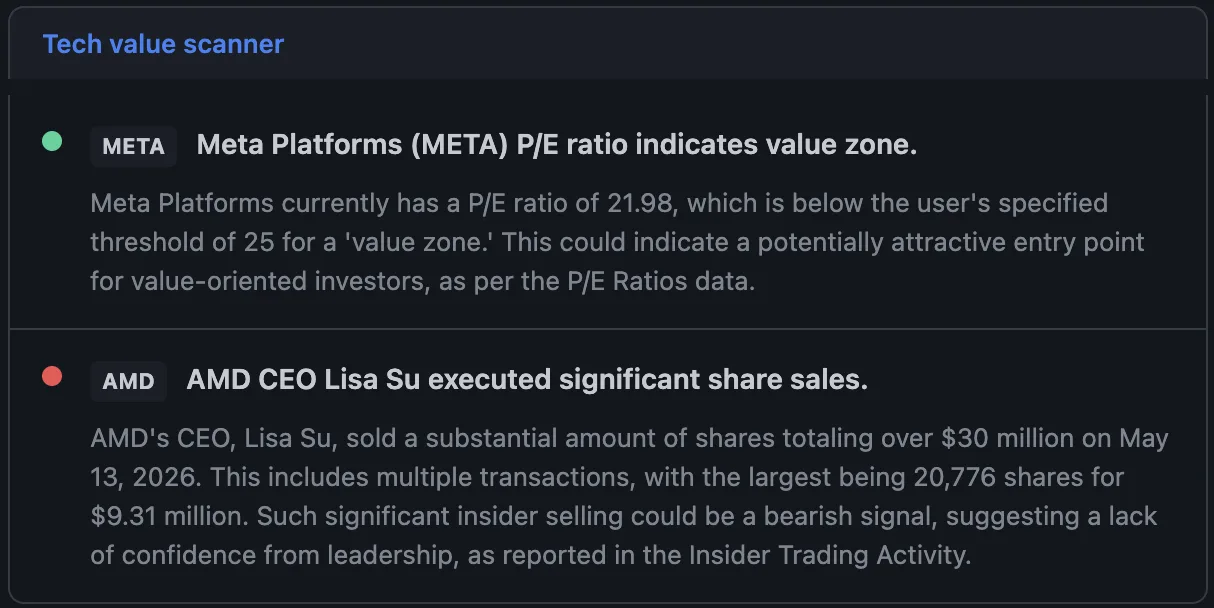
Actionable findings, every morning
Each scout finding includes a signal (bullish, bearish, or neutral), urgency level, and a detailed explanation of what the AI found across your chosen data sources. Scan the results in seconds and decide whether to act.
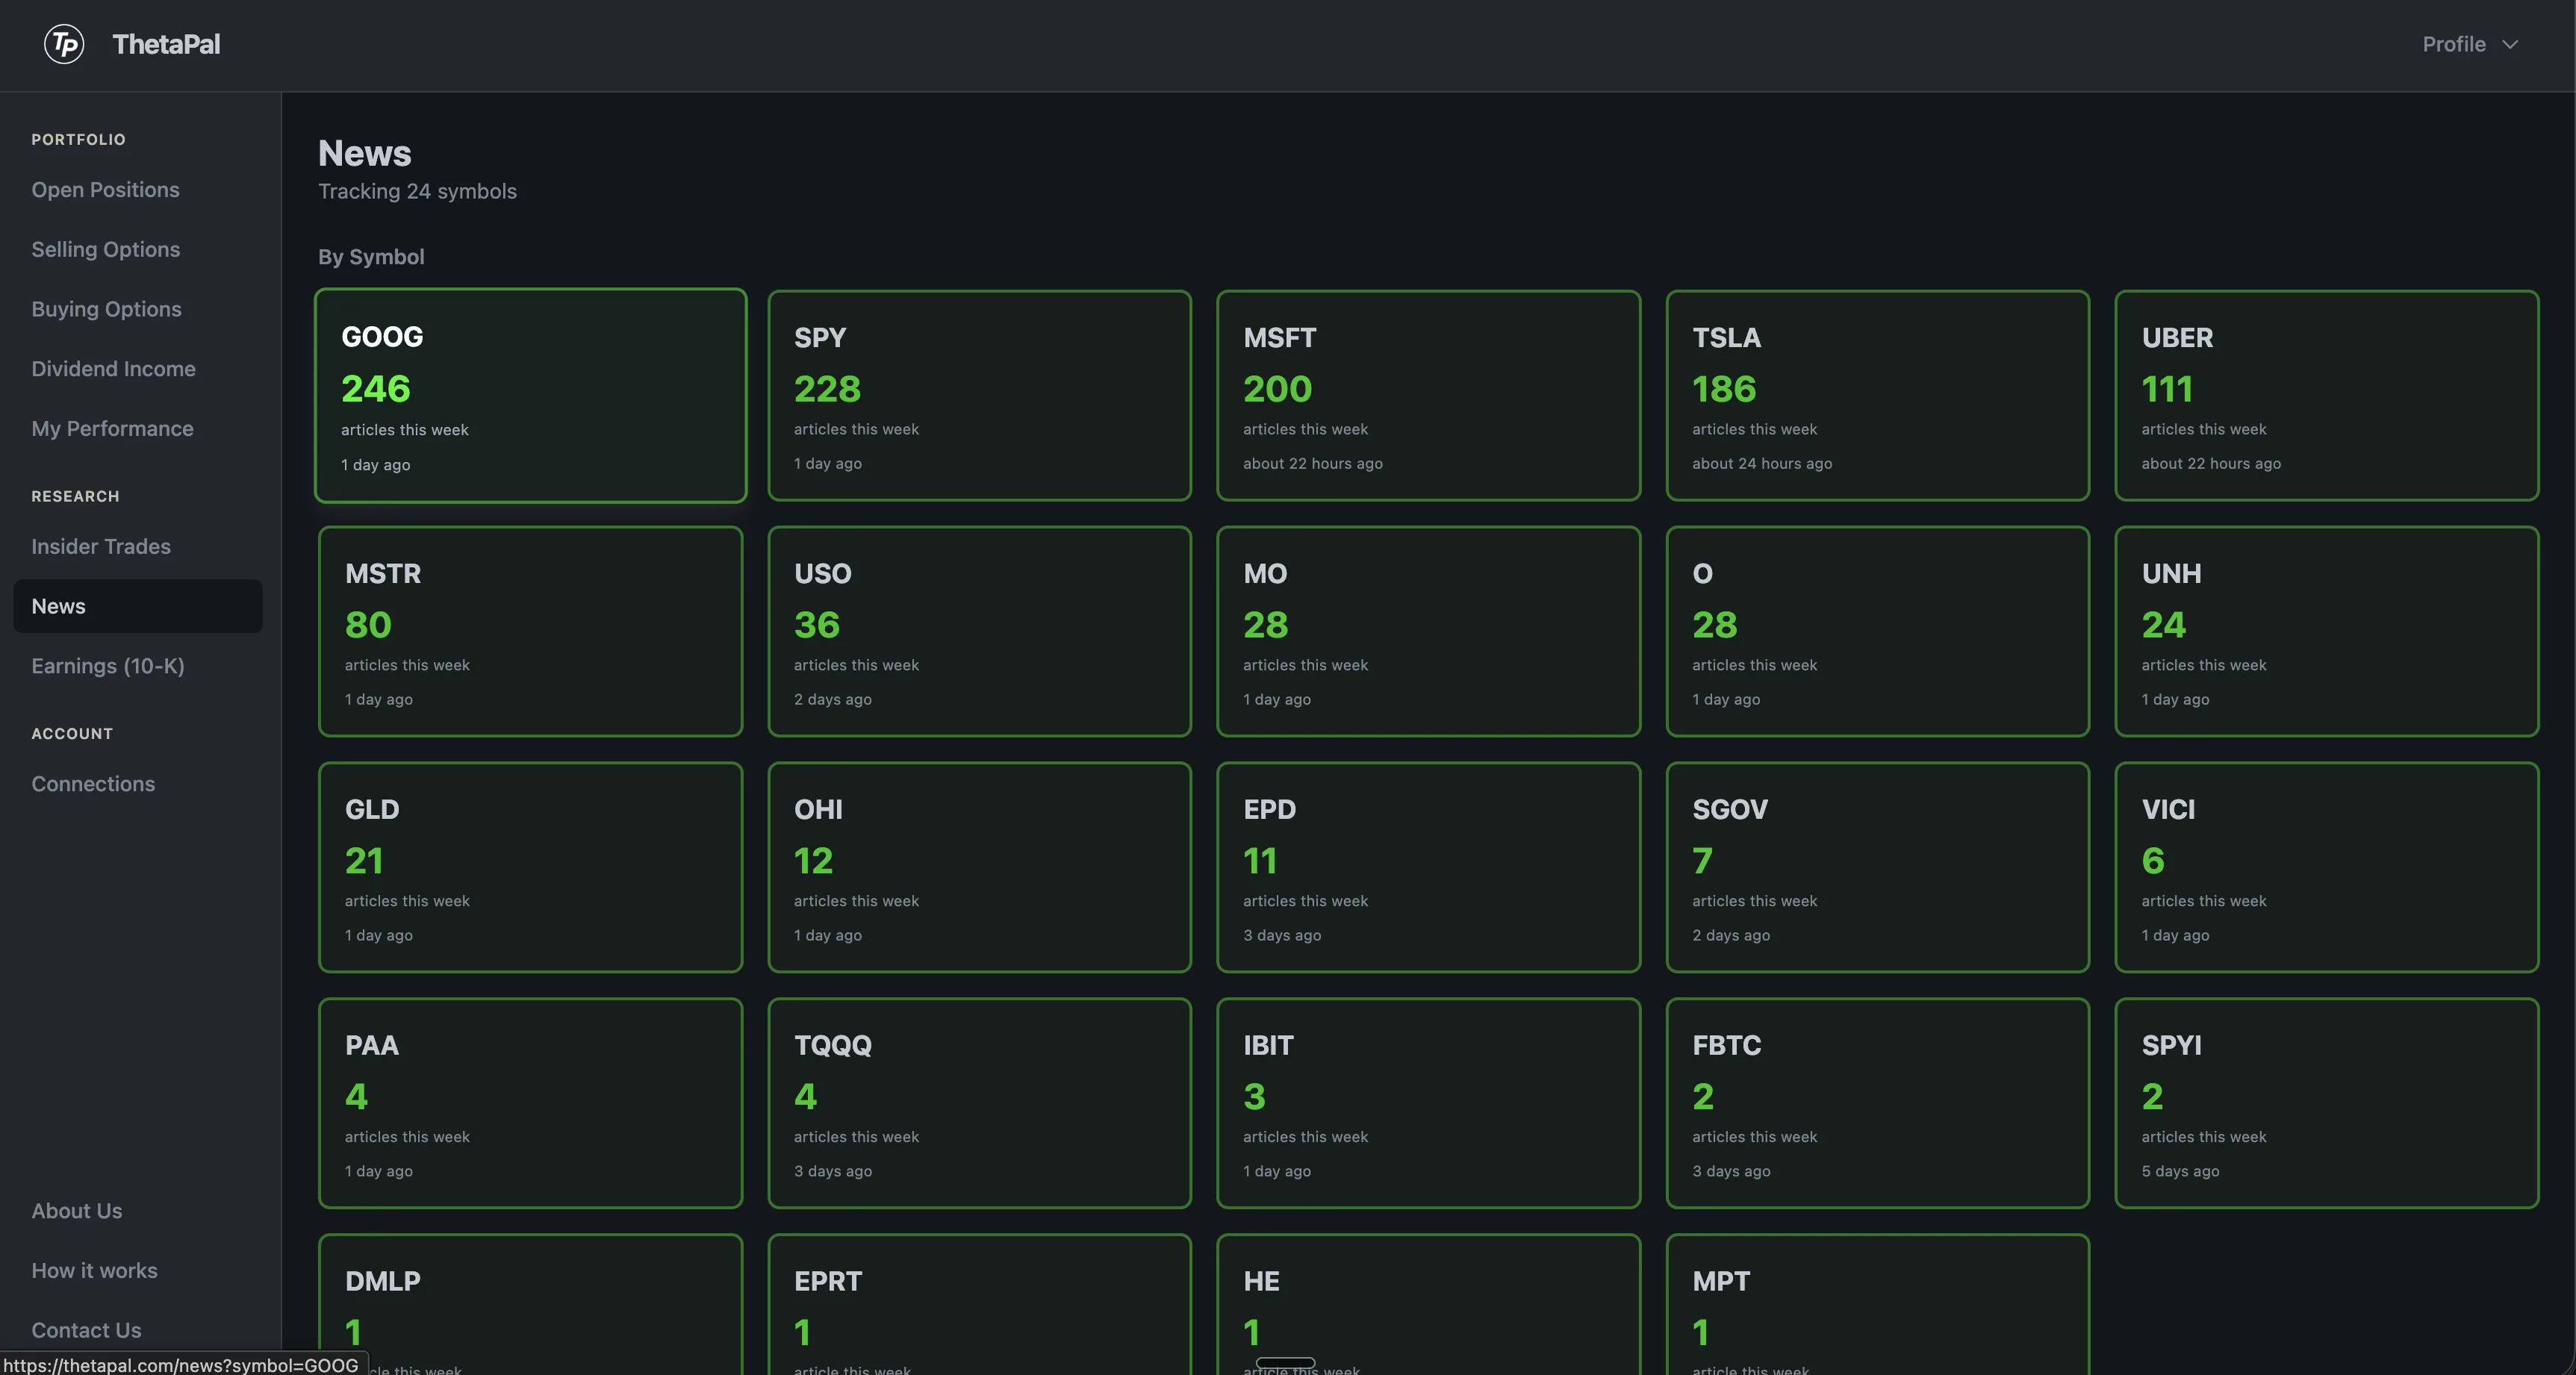
News that matters
ThetaPal aggregates news for every symbol in your portfolio and ranks them by volume. At a glance, see which of your holdings are making headlines and how much coverage each is getting.
Click into any symbol to read the latest articles. No noise from tickers you don't own — only news relevant to your positions.